| Param | Original file | Final file |
|---|---|---|
| Filename | modeM0/AS1T04_029T01_9000004582cztM0_level2_bc.evt | modeM0/AS1T04_029T01_9000004582cztM0_level2_quad_clean.evt |
| Size (bytes) | 6,235,551,360 | 1,681,200,000 |
| Size | 5.8 GB | 1.6 GB |
| Events in quadrant A | 28,697,880 | 10,807,324 |
| Events in quadrant B | 74,333,546 | 10,605,529 |
| Events in quadrant C | 34,819,044 | 10,233,676 |
| Events in quadrant D | 41,846,987 | 10,050,734 |
| Mode SS | |||
|---|---|---|---|
| Quadrant | BADHDUFLAG | Total packets | Discarded packets |
| A | 0 | 2726 | 0 |
| B | 0 | 2730 | 0 |
| C | 0 | 2742 | 0 |
| D | 0 | 2740 | 0 |
| Mode M9 | |||
|---|---|---|---|
| Quadrant | BADHDUFLAG | Total packets | Discarded packets |
| A | 0 | 221 | 0 |
| B | 0 | 221 | 0 |
| C | 0 | 221 | 0 |
| D | 0 | 221 | 0 |
| Mode M0 | |||
|---|---|---|---|
| Quadrant | BADHDUFLAG | Total packets | Discarded packets |
| A | 0 | 279895 | 0 |
| B | 0 | 431311 | 0 |
| C | 0 | 311292 | 0 |
| D | 0 | 318672 | 0 |
| Quadrant | Total seconds | Saturated seconds | Saturation percentage |
|---|---|---|---|
| A | 134754 | 1847 | 1.370646% |
| B | 134342 | 7019 | 5.224725% |
| C | 134720 | 5217 | 3.872476% |
| D | 134699 | 2428 | 1.802538% |
Noise dominated data is calculated using 1-second bins in cleaned event files. If a bin has >2000 counts, and if more than 50% of those come from <1% of pixels, then it is considered to be noise-dominated and hence unusable.
| Quadrant | # 1 sec bins | Bins with >0 counts | Bins with >2000 counts | High rate bins dominated by noise | Noise dominated (total time) | Noise dominated (detector-on time) | Marked lightcurve |
|---|---|---|---|---|---|---|---|
| A | 161551 | 135374 | 0 | 0 | 0.00% | 0.00% | 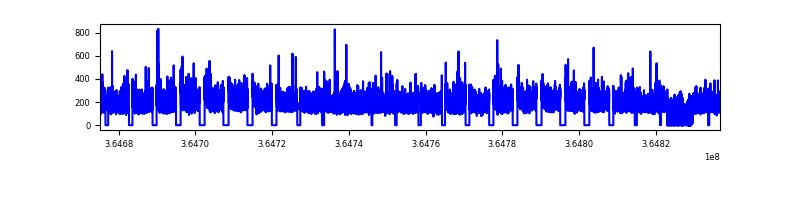 |
| B | 161551 | 134854 | 1316 | 1316 | 0.81% | 0.98% |  |
| C | 161551 | 135353 | 40 | 40 | 0.02% | 0.03% | 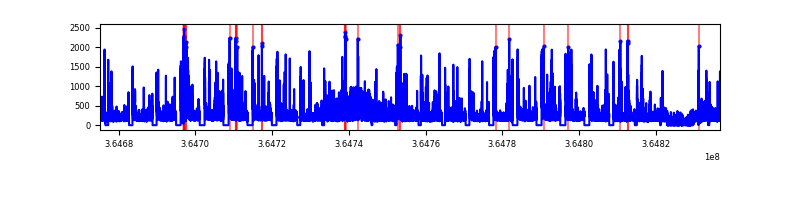 |
| D | 161551 | 135317 | 156 | 156 | 0.10% | 0.12% |  |
Top three noisy pixels from each quadrant. If the there are fewer than three noisy pixels in the level2.evt file, extra rows are filled as -1
| Pixel properties | Quadrant properties | ||||||
|---|---|---|---|---|---|---|---|
| Quadrant | DetID | PixID | Counts | Sigma | Mean | Median | Sigma |
| A | 13 | 254 | 215365 | 131.55 | 7438 | 7327 | 1581.4 |
| A | 0 | 226 | 46599 | 24.83 | 7438 | 7327 | 1581.4 |
| A | 12 | 194 | 42652 | 22.34 | 7438 | 7327 | 1581.4 |
| B | 6 | 159 | 37270670 | 26911.11 | 7381 | 7210 | 1384.7 |
| B | 12 | 1 | 7377657 | 5322.83 | 7381 | 7210 | 1384.7 |
| B | 0 | 190 | 727637 | 520.28 | 7381 | 7210 | 1384.7 |
| C | 3 | 233 | 2770728 | 1661.35 | 7072 | 7058 | 1663.5 |
| C | 0 | 10 | 2170304 | 1300.41 | 7072 | 7058 | 1663.5 |
| C | 10 | 22 | 2071836 | 1241.22 | 7072 | 7058 | 1663.5 |
| D | 8 | 195 | 11159677 | 6834.24 | 7217 | 6998 | 1631.9 |
| D | 12 | 218 | 1539784 | 939.28 | 7217 | 6998 | 1631.9 |
| D | 2 | 250 | 500426 | 302.37 | 7217 | 6998 | 1631.9 |
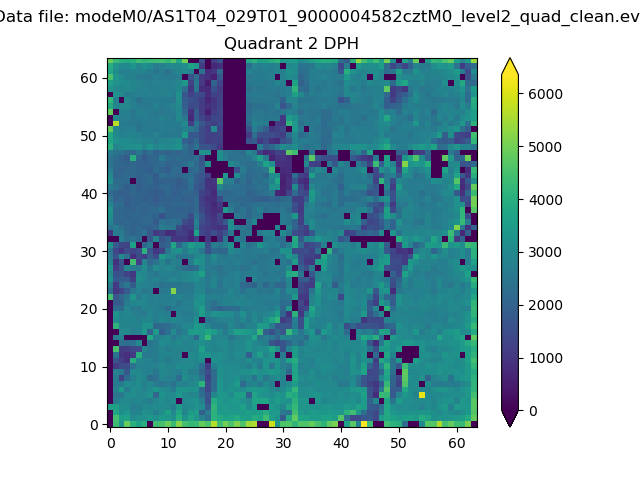
Histogram calculated using DETX and DETY for each event in the final _common_clean file
| Quadrant A |  |
 |
Quadrant B |
|---|---|---|---|
| Quadrant D | 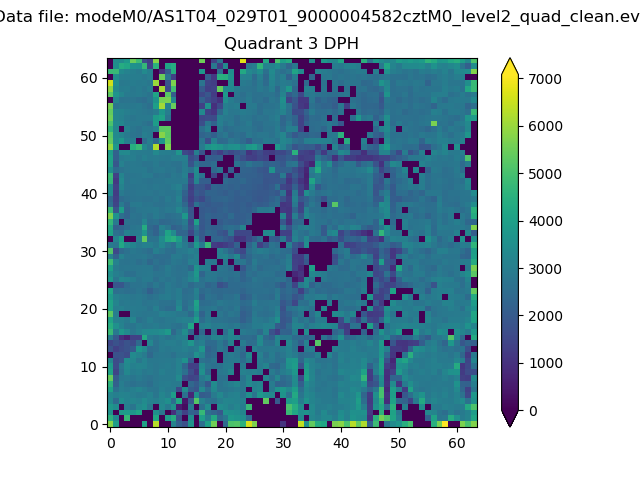 |
 |
Quadrant C |
| Plot type | Count rate plots | Images |
|---|---|---|
| Comparison with Poisson distribution Blue bars denote a histogram of data divided into 1 sec bins. Red curve is a Poisson curve with rate = median count rate of data. |
 |
 |
| Quadrant-wise count rates Data is divided into 100 sec bins |
 |
|
| Module-wise count rates for Quadrant A Data is divided into 100 sec bins |
 |
 |
| Module-wise count rates for Quadrant B Data is divided into 100 sec bins |
 |
 |
| Module-wise count rates for Quadrant C Data is divided into 100 sec bins |
 |
 |
| Module-wise count rates for Quadrant D Data is divided into 100 sec bins |
 |
 |
| Parameter | Plot |
|---|---|
| CZT HV Monitor | 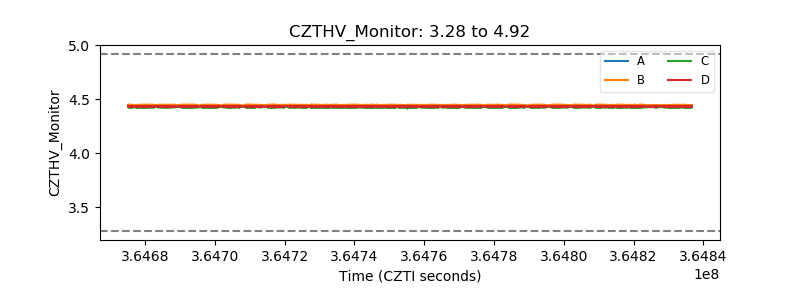 |
| D_VDD |  |
| Temperature 1 |  |
| Veto HV Monitor | 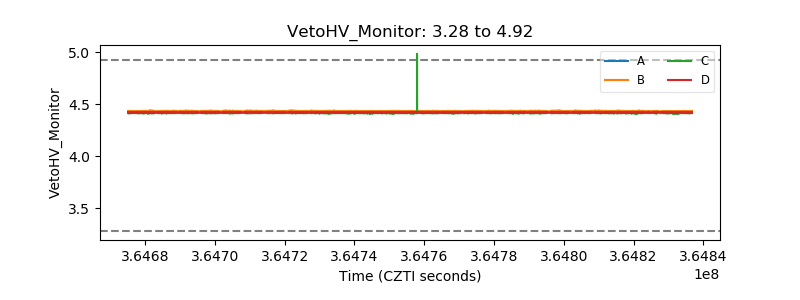 |
| Veto LLD |  |
| Alpha Counter | 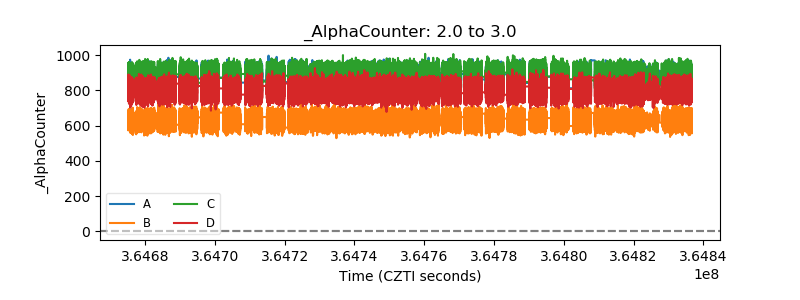 |
| _CPM_Rate |  |
| CZT Counter |  |
| +2.5 Volts monitor | 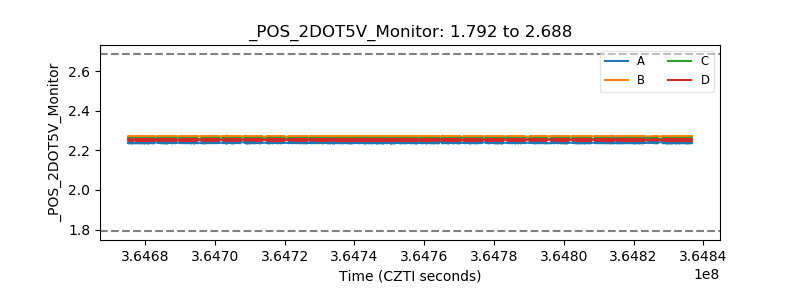 |
| +5 Volts monitor |  |
| _ROLL_ROT | 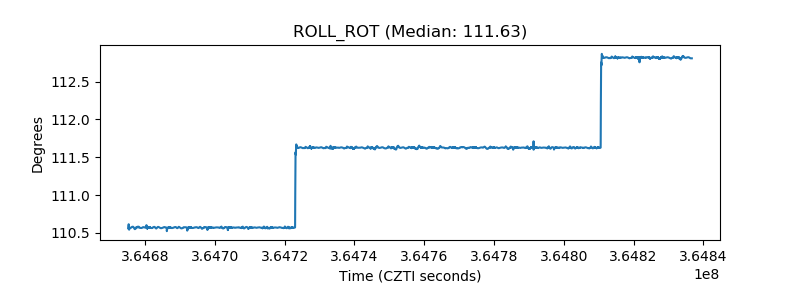 |
| _Roll_DEC | 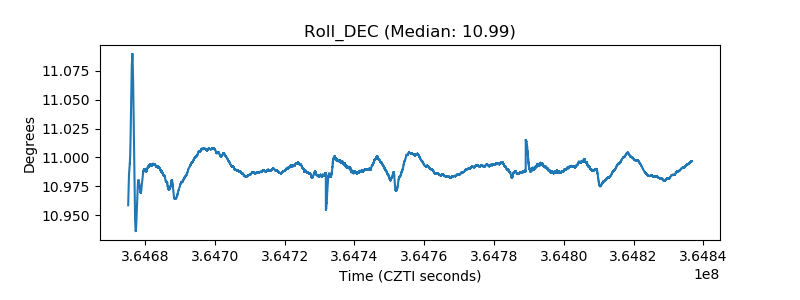 |
| _Roll_RA |  |
| Veto Counter |  |