| Param | Original file | Final file |
|---|---|---|
| Filename | modeM0/AS1C06_005T01_9000004580cztM0_level2_bc.evt | modeM0/AS1C06_005T01_9000004580cztM0_level2_quad_clean.evt |
| Size (bytes) | 3,467,378,880 | 1,111,089,600 |
| Size | 3.2 GB | 1.0 GB |
| Events in quadrant A | 12,579,463 | 8,101,805 |
| Events in quadrant B | 47,599,444 | 5,800,645 |
| Events in quadrant C | 15,887,022 | 7,935,555 |
| Events in quadrant D | 24,909,504 | 7,745,518 |
| Mode M0 | |||
|---|---|---|---|
| Quadrant | BADHDUFLAG | Total packets | Discarded packets |
| A | 0 | 122239 | 0 |
| B | 0 | 293003 | 0 |
| C | 0 | 137551 | 0 |
| D | 0 | 160966 | 0 |
| Mode M9 | |||
|---|---|---|---|
| Quadrant | BADHDUFLAG | Total packets | Discarded packets |
| A | 0 | 82 | 0 |
| B | 0 | 82 | 0 |
| C | 0 | 82 | 0 |
| D | 0 | 82 | 0 |
| Mode SS | |||
|---|---|---|---|
| Quadrant | BADHDUFLAG | Total packets | Discarded packets |
| A | 0 | 1224 | 0 |
| B | 0 | 1216 | 0 |
| C | 0 | 1222 | 0 |
| D | 0 | 1208 | 0 |
| Quadrant | Total seconds | Saturated seconds | Saturation percentage |
|---|---|---|---|
| A | 59386 | 762 | 1.283131% |
| B | 58760 | 21592 | 36.746086% |
| C | 59386 | 2681 | 4.514532% |
| D | 59204 | 1831 | 3.092696% |
Noise dominated data is calculated using 1-second bins in cleaned event files. If a bin has >2000 counts, and if more than 50% of those come from <1% of pixels, then it is considered to be noise-dominated and hence unusable.
| Quadrant | # 1 sec bins | Bins with >0 counts | Bins with >2000 counts | High rate bins dominated by noise | Noise dominated (total time) | Noise dominated (detector-on time) | Marked lightcurve |
|---|---|---|---|---|---|---|---|
| A | 77725 | 59758 | 2 | 2 | 0.00% | 0.00% |  |
| B | 77725 | 58893 | 1935 | 1935 | 2.49% | 3.29% |  |
| C | 77725 | 59750 | 13 | 13 | 0.02% | 0.02% |  |
| D | 77725 | 59601 | 226 | 226 | 0.29% | 0.38% |  |
Top three noisy pixels from each quadrant. If the there are fewer than three noisy pixels in the level2.evt file, extra rows are filled as -1
| Pixel properties | Quadrant properties | ||||||
|---|---|---|---|---|---|---|---|
| Quadrant | DetID | PixID | Counts | Sigma | Mean | Median | Sigma |
| A | 13 | 254 | 112630 | 157.48 | 3245 | 3203 | 694.9 |
| A | 12 | 194 | 22684 | 28.04 | 3245 | 3203 | 694.9 |
| A | 12 | 16 | 21267 | 26.0 | 3245 | 3203 | 694.9 |
| B | 12 | 1 | 24539890 | 53632.32 | 2387 | 2332 | 457.5 |
| B | 6 | 159 | 12232611 | 26732.01 | 2387 | 2332 | 457.5 |
| B | 4 | 80 | 659586 | 1436.58 | 2387 | 2332 | 457.5 |
| C | 3 | 233 | 2610690 | 3463.82 | 3164 | 3163 | 752.8 |
| C | 0 | 10 | 591883 | 782.05 | 3164 | 3163 | 752.8 |
| C | 14 | 254 | 157808 | 205.43 | 3164 | 3163 | 752.8 |
| D | 8 | 195 | 5847804 | 7911.89 | 3216 | 3125 | 738.7 |
| D | 1 | 52 | 2392661 | 3234.7 | 3216 | 3125 | 738.7 |
| D | 12 | 218 | 2057624 | 2781.16 | 3216 | 3125 | 738.7 |
Histogram calculated using DETX and DETY for each event in the final _common_clean file
| Quadrant A |  |
 |
Quadrant B |
|---|---|---|---|
| Quadrant D | 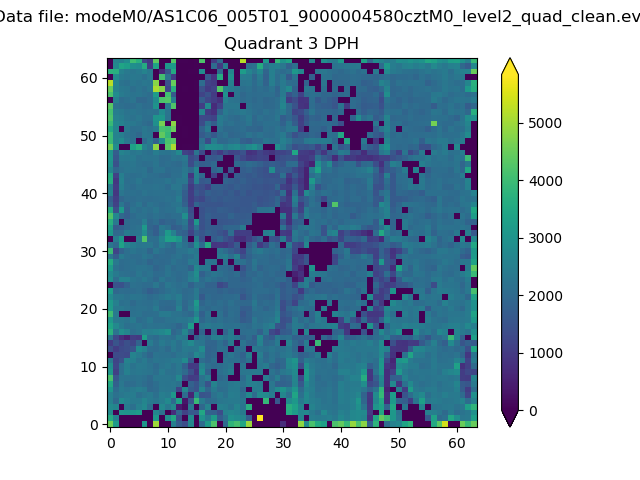 |
 |
Quadrant C |
| Plot type | Count rate plots | Images |
|---|---|---|
| Comparison with Poisson distribution Blue bars denote a histogram of data divided into 1 sec bins. Red curve is a Poisson curve with rate = median count rate of data. |
 |
 |
| Quadrant-wise count rates Data is divided into 100 sec bins |
 |
|
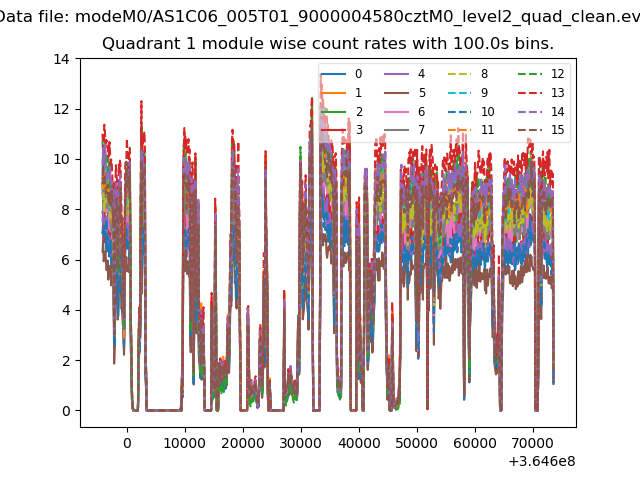
| Module-wise count rates for Quadrant A Data is divided into 100 sec bins |
 |
 |
| Module-wise count rates for Quadrant B Data is divided into 100 sec bins |
 |
 |
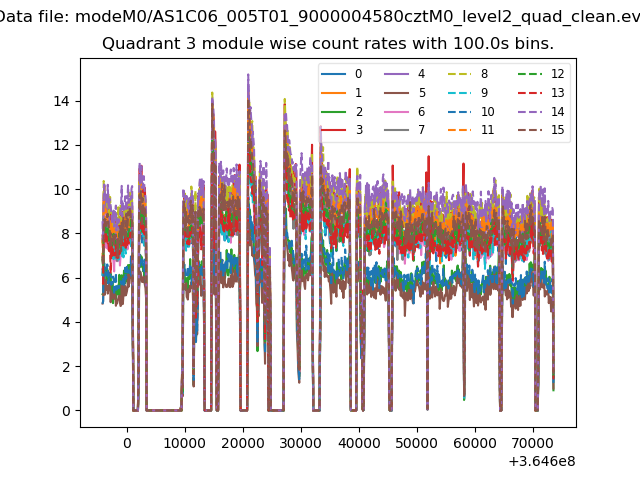
| Module-wise count rates for Quadrant C Data is divided into 100 sec bins |
 |
 |
| Module-wise count rates for Quadrant D Data is divided into 100 sec bins |
 |
 |
| Parameter | Plot |
|---|---|
| CZT HV Monitor |  |
| D_VDD |  |
| Temperature 1 |  |
| Veto HV Monitor |  |
| Veto LLD |  |
| Alpha Counter |  |
| _CPM_Rate |  |
| CZT Counter |  |
| +2.5 Volts monitor |  |
| +5 Volts monitor | 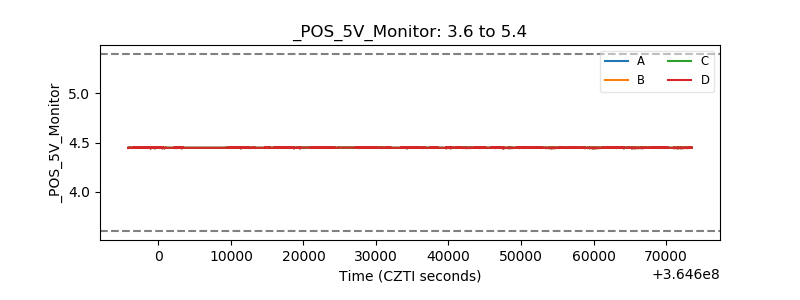 |
| _ROLL_ROT | 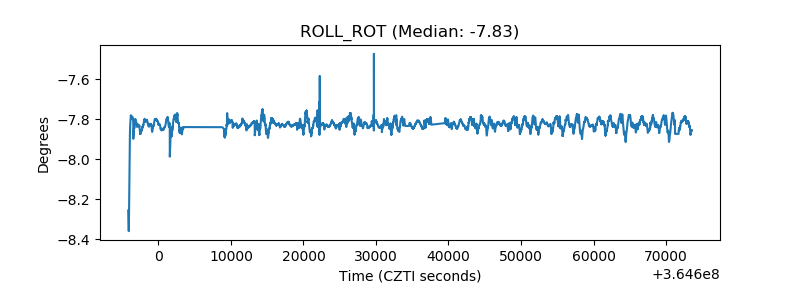 |
| _Roll_DEC | 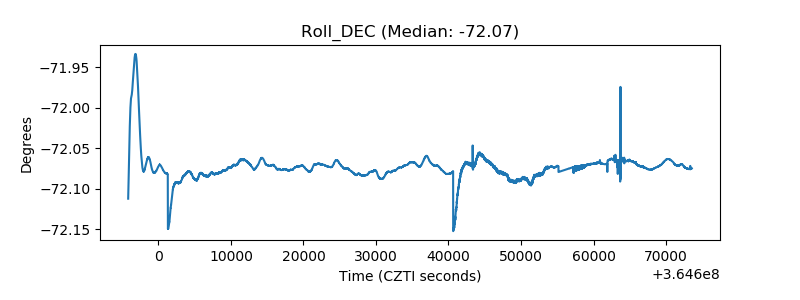 |
| _Roll_RA |  |
| Veto Counter |  |