| Param | Original file | Final file |
|---|---|---|
| Filename | modeM0/AS1A10_094T34_9000004574cztM0_level2_bc.evt | modeM0/AS1A10_094T34_9000004574cztM0_level2_quad_clean.evt |
| Size (bytes) | 259,632,000 | 97,464,960 |
| Size | 247.6 MB | 92.9 MB |
| Events in quadrant A | 1,037,197 | 665,644 |
| Events in quadrant B | 2,971,874 | 646,530 |
| Events in quadrant C | 1,268,513 | 641,995 |
| Events in quadrant D | 2,221,463 | 630,492 |
| Mode M0 | |||
|---|---|---|---|
| Quadrant | BADHDUFLAG | Total packets | Discarded packets |
| A | 0 | 10698 | 0 |
| B | 0 | 17803 | 0 |
| C | 0 | 11938 | 0 |
| D | 0 | 14412 | 0 |
| Mode SS | |||
|---|---|---|---|
| Quadrant | BADHDUFLAG | Total packets | Discarded packets |
| A | 0 | 108 | 0 |
| B | 0 | 108 | 0 |
| C | 0 | 108 | 0 |
| D | 0 | 108 | 0 |
| Mode M9 | |||
|---|---|---|---|
| Quadrant | BADHDUFLAG | Total packets | Discarded packets |
| A | 0 | 3 | 0 |
| B | 0 | 3 | 0 |
| C | 0 | 3 | 0 |
| D | 0 | 3 | 0 |
| Quadrant | Total seconds | Saturated seconds | Saturation percentage |
|---|---|---|---|
| A | 5232 | 58 | 1.108563% |
| B | 5232 | 287 | 5.485474% |
| C | 5232 | 327 | 6.250000% |
| D | 5232 | 227 | 4.338685% |
Noise dominated data is calculated using 1-second bins in cleaned event files. If a bin has >2000 counts, and if more than 50% of those come from <1% of pixels, then it is considered to be noise-dominated and hence unusable.
| Quadrant | # 1 sec bins | Bins with >0 counts | Bins with >2000 counts | High rate bins dominated by noise | Noise dominated (total time) | Noise dominated (detector-on time) | Marked lightcurve |
|---|---|---|---|---|---|---|---|
| A | 5542 | 5232 | 0 | 0 | 0.00% | 0.00% | 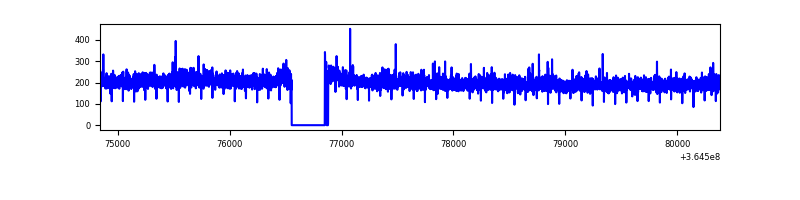 |
| B | 5542 | 5232 | 0 | 0 | 0.00% | 0.00% |  |
| C | 5542 | 5232 | 0 | 0 | 0.00% | 0.00% |  |
| D | 5542 | 5233 | 21 | 21 | 0.38% | 0.40% |  |
Top three noisy pixels from each quadrant. If the there are fewer than three noisy pixels in the level2.evt file, extra rows are filled as -1
| Pixel properties | Quadrant properties | ||||||
|---|---|---|---|---|---|---|---|
| Quadrant | DetID | PixID | Counts | Sigma | Mean | Median | Sigma |
| A | 13 | 254 | 10743 | 173.1 | 267 | 262 | 60.5 |
| A | 5 | 203 | 2001 | 28.72 | 267 | 262 | 60.5 |
| A | 0 | 226 | 1681 | 23.44 | 267 | 262 | 60.5 |
| B | 6 | 159 | 1414944 | 26409.16 | 261 | 254 | 53.6 |
| B | 12 | 1 | 437416 | 8160.86 | 261 | 254 | 53.6 |
| B | 4 | 80 | 47725 | 886.18 | 261 | 254 | 53.6 |
| C | 3 | 233 | 219360 | 3440.74 | 255 | 252 | 63.7 |
| C | 14 | 254 | 34398 | 536.21 | 255 | 252 | 63.7 |
| C | 14 | 176 | 14534 | 224.28 | 255 | 252 | 63.7 |
| D | 8 | 195 | 505452 | 7977.32 | 261 | 251 | 63.3 |
| D | 12 | 218 | 350749 | 5534.5 | 261 | 251 | 63.3 |
| D | 1 | 52 | 102364 | 1612.4 | 261 | 251 | 63.3 |
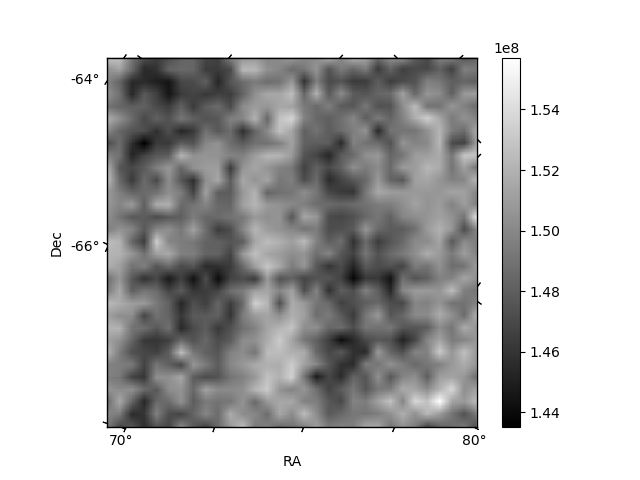
Histogram calculated using DETX and DETY for each event in the final _common_clean file
| Quadrant A |  |
 |
Quadrant B |
|---|---|---|---|
| Quadrant D |  |
 |
Quadrant C |
| Plot type | Count rate plots | Images |
|---|---|---|
| Comparison with Poisson distribution Blue bars denote a histogram of data divided into 1 sec bins. Red curve is a Poisson curve with rate = median count rate of data. |
 |
 |
| Quadrant-wise count rates Data is divided into 100 sec bins |
 |
|
| Module-wise count rates for Quadrant A Data is divided into 100 sec bins |
 |
 |
| Module-wise count rates for Quadrant B Data is divided into 100 sec bins |
 |
 |
| Module-wise count rates for Quadrant C Data is divided into 100 sec bins |
 |
 |
| Module-wise count rates for Quadrant D Data is divided into 100 sec bins |
 |
 |
| Parameter | Plot |
|---|---|
| CZT HV Monitor |  |
| D_VDD |  |
| Temperature 1 |  |
| Veto HV Monitor |  |
| Veto LLD |  |
| Alpha Counter |  |
| _CPM_Rate | 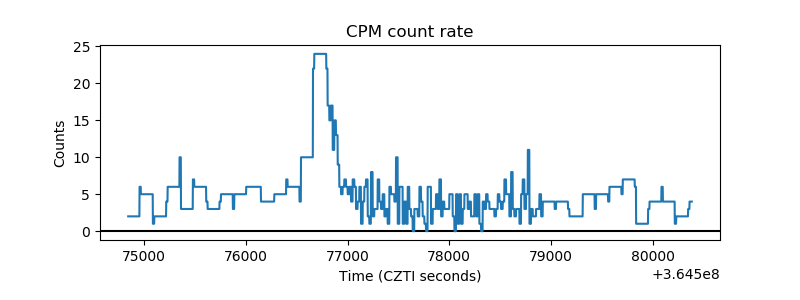 |
| CZT Counter |  |
| +2.5 Volts monitor |  |
| +5 Volts monitor |  |
| _ROLL_ROT |  |
| _Roll_DEC |  |
| _Roll_RA |  |
| Veto Counter |  |