| Param | Original file | Final file |
|---|---|---|
| Filename | modeM0/AS1A10_094T33_9000004572cztM0_level2_bc.evt | modeM0/AS1A10_094T33_9000004572cztM0_level2_quad_clean.evt |
| Size (bytes) | 276,865,920 | 102,168,000 |
| Size | 264.0 MB | 97.4 MB |
| Events in quadrant A | 1,125,605 | 704,806 |
| Events in quadrant B | 3,878,222 | 623,148 |
| Events in quadrant C | 1,104,559 | 694,432 |
| Events in quadrant D | 1,892,722 | 685,249 |
| Mode SS | |||
|---|---|---|---|
| Quadrant | BADHDUFLAG | Total packets | Discarded packets |
| A | 0 | 110 | 0 |
| B | 0 | 110 | 0 |
| C | 0 | 110 | 0 |
| D | 0 | 110 | 0 |
| Mode M0 | |||
|---|---|---|---|
| Quadrant | BADHDUFLAG | Total packets | Discarded packets |
| A | 0 | 11517 | 0 |
| B | 0 | 25052 | 0 |
| C | 0 | 11680 | 0 |
| D | 0 | 13603 | 0 |
| Quadrant | Total seconds | Saturated seconds | Saturation percentage |
|---|---|---|---|
| A | 5510 | 252 | 4.573503% |
| B | 5510 | 1847 | 33.520871% |
| C | 5510 | 318 | 5.771325% |
| D | 5510 | 243 | 4.410163% |
Noise dominated data is calculated using 1-second bins in cleaned event files. If a bin has >2000 counts, and if more than 50% of those come from <1% of pixels, then it is considered to be noise-dominated and hence unusable.
| Quadrant | # 1 sec bins | Bins with >0 counts | Bins with >2000 counts | High rate bins dominated by noise | Noise dominated (total time) | Noise dominated (detector-on time) | Marked lightcurve |
|---|---|---|---|---|---|---|---|
| A | 5540 | 5510 | 0 | 0 | 0.00% | 0.00% |  |
| B | 5540 | 5509 | 0 | 0 | 0.00% | 0.00% |  |
| C | 5540 | 5511 | 0 | 0 | 0.00% | 0.00% |  |
| D | 5540 | 5510 | 22 | 22 | 0.40% | 0.40% | 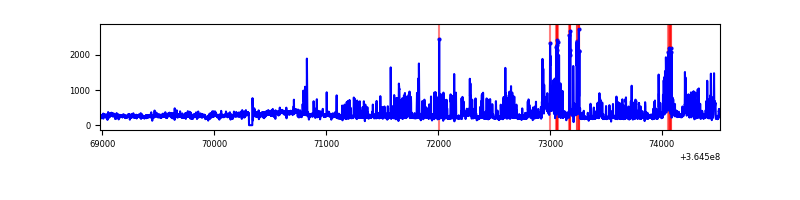 |
Top three noisy pixels from each quadrant. If the there are fewer than three noisy pixels in the level2.evt file, extra rows are filled as -1
| Pixel properties | Quadrant properties | ||||||
|---|---|---|---|---|---|---|---|
| Quadrant | DetID | PixID | Counts | Sigma | Mean | Median | Sigma |
| A | 12 | 16 | 26774 | 413.84 | 282 | 276 | 64.0 |
| A | 13 | 254 | 10622 | 161.58 | 282 | 276 | 64.0 |
| A | 12 | 194 | 6187 | 92.32 | 282 | 276 | 64.0 |
| B | 6 | 159 | 1334913 | 26450.01 | 253 | 247 | 50.5 |
| B | 12 | 1 | 1247087 | 24709.5 | 253 | 247 | 50.5 |
| B | 12 | 2 | 104126 | 2058.64 | 253 | 247 | 50.5 |
| C | 3 | 233 | 10958 | 157.76 | 274 | 272 | 67.7 |
| C | 14 | 254 | 10922 | 157.23 | 274 | 272 | 67.7 |
| C | 15 | 208 | 10877 | 156.57 | 274 | 272 | 67.7 |
| D | 8 | 195 | 502243 | 7046.86 | 282 | 272 | 71.2 |
| D | 12 | 218 | 134863 | 1889.44 | 282 | 272 | 71.2 |
| D | 5 | 233 | 63170 | 882.99 | 282 | 272 | 71.2 |
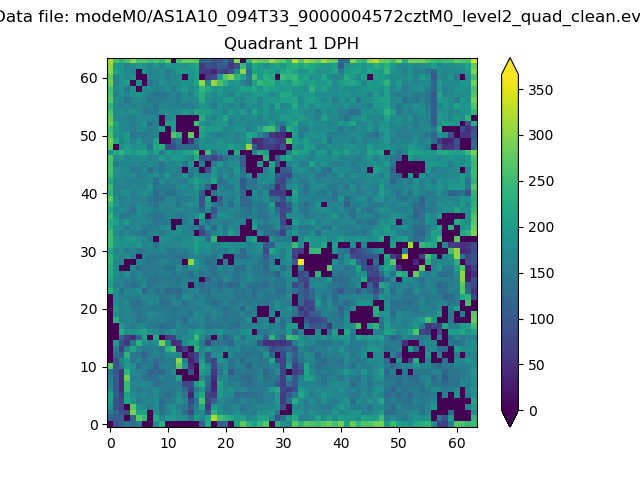
Histogram calculated using DETX and DETY for each event in the final _common_clean file
| Quadrant A |  |
 |
Quadrant B |
|---|---|---|---|
| Quadrant D |  |
 |
Quadrant C |
| Plot type | Count rate plots | Images |
|---|---|---|
| Comparison with Poisson distribution Blue bars denote a histogram of data divided into 1 sec bins. Red curve is a Poisson curve with rate = median count rate of data. |
 |
 |
| Quadrant-wise count rates Data is divided into 100 sec bins |
 |
|
| Module-wise count rates for Quadrant A Data is divided into 100 sec bins |
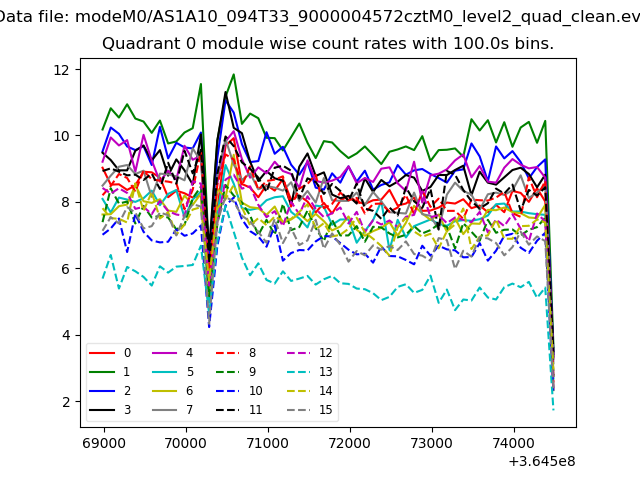 |
 |
| Module-wise count rates for Quadrant B Data is divided into 100 sec bins |
 |
 |
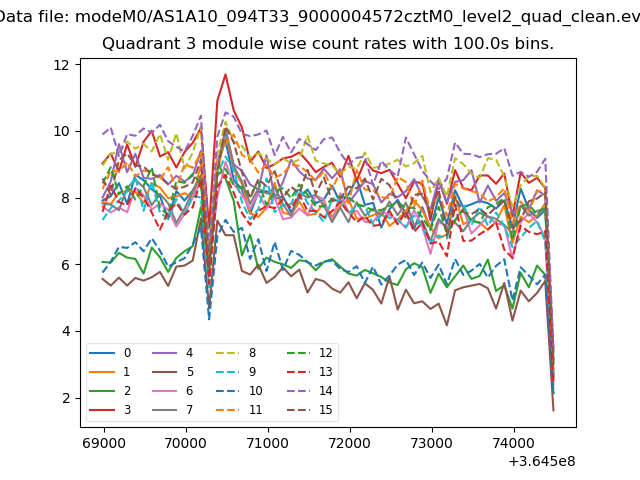
| Module-wise count rates for Quadrant C Data is divided into 100 sec bins |
 |
 |
| Module-wise count rates for Quadrant D Data is divided into 100 sec bins |
 |
 |
| Parameter | Plot |
|---|---|
| CZT HV Monitor |  |
| D_VDD |  |
| Temperature 1 |  |
| Veto HV Monitor |  |
| Veto LLD |  |
| Alpha Counter | 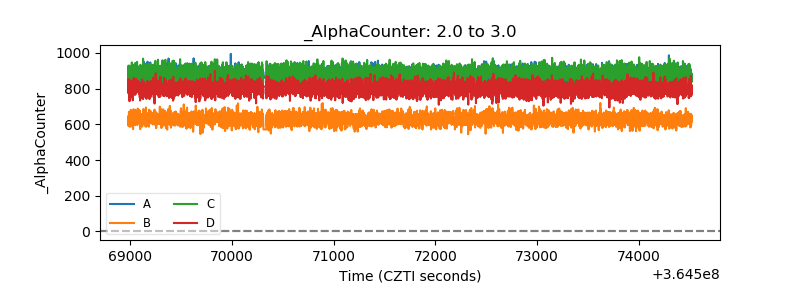 |
| _CPM_Rate |  |
| CZT Counter |  |
| +2.5 Volts monitor |  |
| +5 Volts monitor |  |
| _ROLL_ROT |  |
| _Roll_DEC | 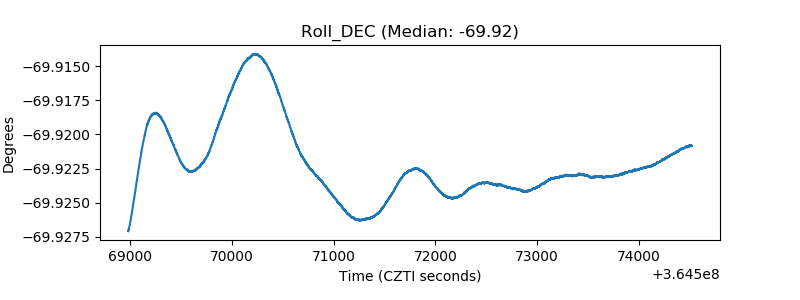 |
| _Roll_RA |  |
| Veto Counter |  |