| Param | Original file | Final file |
|---|---|---|
| Filename | modeM0/AS1A10_094T32_9000004570cztM0_level2_bc.evt | modeM0/AS1A10_094T32_9000004570cztM0_level2_quad_clean.evt |
| Size (bytes) | 238,720,320 | 98,196,480 |
| Size | 227.7 MB | 93.6 MB |
| Events in quadrant A | 1,063,487 | 665,906 |
| Events in quadrant B | 2,799,199 | 653,546 |
| Events in quadrant C | 1,045,824 | 650,441 |
| Events in quadrant D | 1,959,918 | 639,976 |
| Mode M0 | |||
|---|---|---|---|
| Quadrant | BADHDUFLAG | Total packets | Discarded packets |
| A | 0 | 10676 | 0 |
| B | 0 | 16663 | 0 |
| C | 0 | 10949 | 0 |
| D | 0 | 13419 | 0 |
| Mode SS | |||
|---|---|---|---|
| Quadrant | BADHDUFLAG | Total packets | Discarded packets |
| A | 0 | 108 | 0 |
| B | 0 | 108 | 0 |
| C | 0 | 108 | 0 |
| D | 0 | 108 | 0 |
| Mode M9 | |||
|---|---|---|---|
| Quadrant | BADHDUFLAG | Total packets | Discarded packets |
| A | 0 | 3 | 0 |
| B | 0 | 3 | 0 |
| C | 0 | 3 | 0 |
| D | 0 | 3 | 0 |
| Quadrant | Total seconds | Saturated seconds | Saturation percentage |
|---|---|---|---|
| A | 5185 | 167 | 3.220829% |
| B | 5185 | 298 | 5.747348% |
| C | 5185 | 332 | 6.403086% |
| D | 5185 | 309 | 5.959499% |
Noise dominated data is calculated using 1-second bins in cleaned event files. If a bin has >2000 counts, and if more than 50% of those come from <1% of pixels, then it is considered to be noise-dominated and hence unusable.
| Quadrant | # 1 sec bins | Bins with >0 counts | Bins with >2000 counts | High rate bins dominated by noise | Noise dominated (total time) | Noise dominated (detector-on time) | Marked lightcurve |
|---|---|---|---|---|---|---|---|
| A | 5540 | 5184 | 0 | 0 | 0.00% | 0.00% |  |
| B | 5540 | 5184 | 3 | 3 | 0.05% | 0.06% | 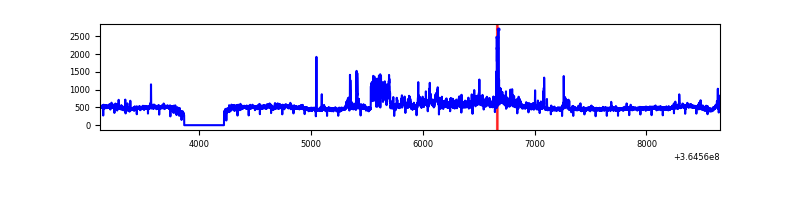 |
| C | 5540 | 5184 | 0 | 0 | 0.00% | 0.00% |  |
| D | 5540 | 5184 | 47 | 47 | 0.85% | 0.91% | 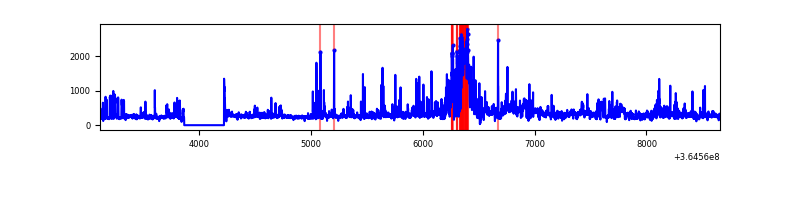 |
Top three noisy pixels from each quadrant. If the there are fewer than three noisy pixels in the level2.evt file, extra rows are filled as -1
| Pixel properties | Quadrant properties | ||||||
|---|---|---|---|---|---|---|---|
| Quadrant | DetID | PixID | Counts | Sigma | Mean | Median | Sigma |
| A | 12 | 16 | 26126 | 428.52 | 267 | 261 | 60.4 |
| A | 13 | 254 | 10518 | 169.93 | 267 | 261 | 60.4 |
| A | 12 | 194 | 5738 | 90.74 | 267 | 261 | 60.4 |
| B | 6 | 159 | 1367278 | 25766.46 | 263 | 257 | 53.1 |
| B | 12 | 1 | 305796 | 5758.99 | 263 | 257 | 53.1 |
| B | 4 | 80 | 56623 | 1062.42 | 263 | 257 | 53.1 |
| C | 14 | 254 | 28214 | 435.75 | 257 | 256 | 64.2 |
| C | 3 | 233 | 14929 | 228.69 | 257 | 256 | 64.2 |
| C | 2 | 114 | 9690 | 147.04 | 257 | 256 | 64.2 |
| D | 8 | 195 | 468779 | 7098.13 | 263 | 254 | 66.0 |
| D | 13 | 249 | 173046 | 2617.79 | 263 | 254 | 66.0 |
| D | 12 | 218 | 104577 | 1580.49 | 263 | 254 | 66.0 |
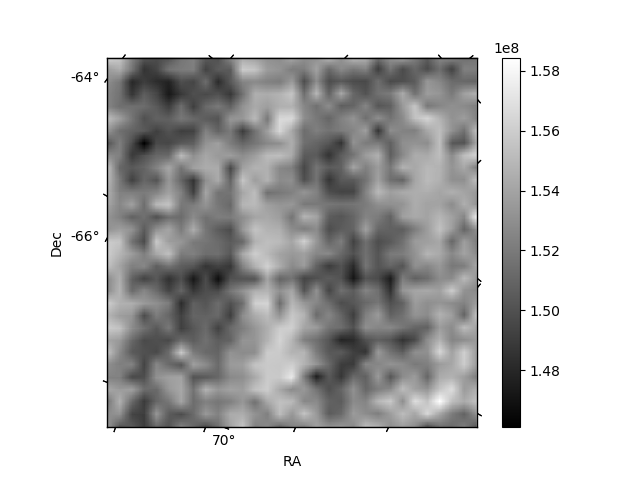
Histogram calculated using DETX and DETY for each event in the final _common_clean file
| Quadrant A |  |
 |
Quadrant B |
|---|---|---|---|
| Quadrant D |  |
 |
Quadrant C |
| Plot type | Count rate plots | Images |
|---|---|---|
| Comparison with Poisson distribution Blue bars denote a histogram of data divided into 1 sec bins. Red curve is a Poisson curve with rate = median count rate of data. |
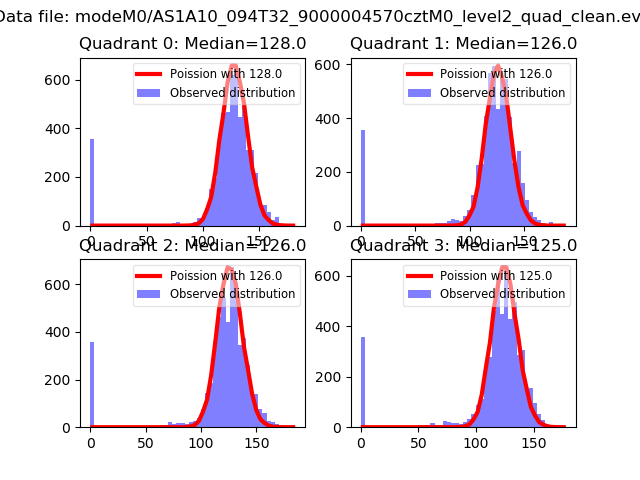 |
 |
| Quadrant-wise count rates Data is divided into 100 sec bins |
 |
|
| Module-wise count rates for Quadrant A Data is divided into 100 sec bins |
 |
 |
| Module-wise count rates for Quadrant B Data is divided into 100 sec bins |
 |
 |
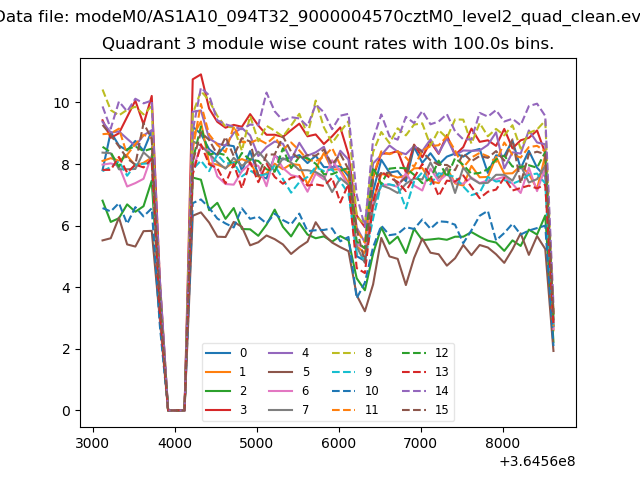
| Module-wise count rates for Quadrant C Data is divided into 100 sec bins |
 |
 |
| Module-wise count rates for Quadrant D Data is divided into 100 sec bins |
 |
 |
| Parameter | Plot |
|---|---|
| CZT HV Monitor | 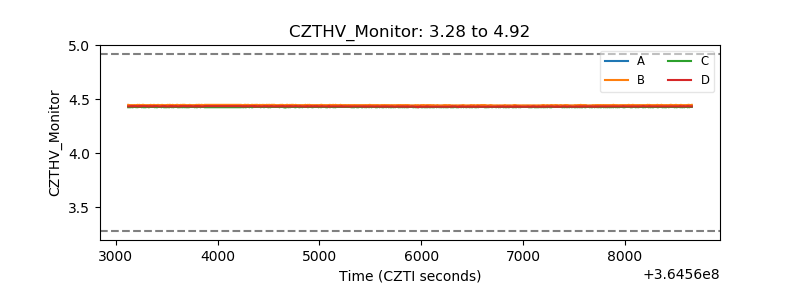 |
| D_VDD |  |
| Temperature 1 |  |
| Veto HV Monitor |  |
| Veto LLD | 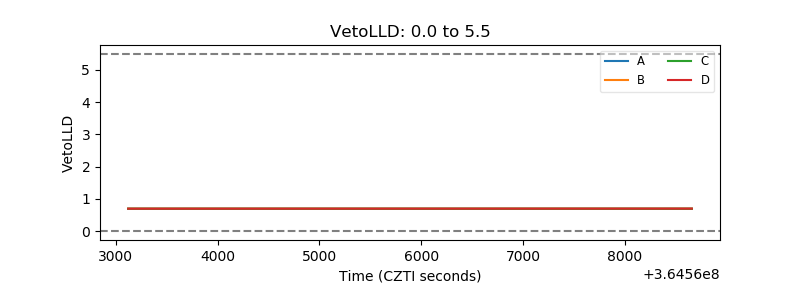 |
| Alpha Counter |  |
| _CPM_Rate | 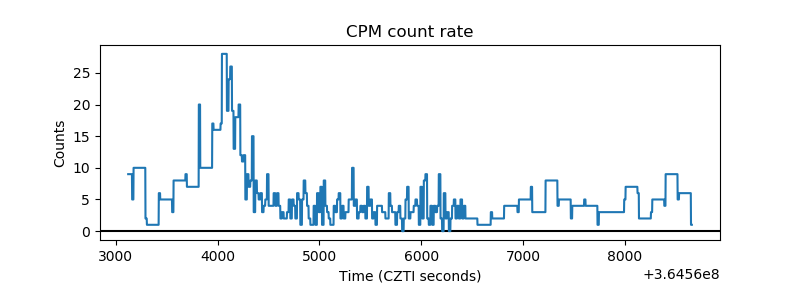 |
| CZT Counter | 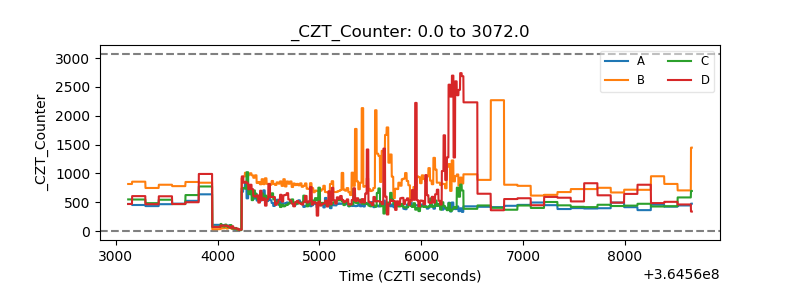 |
| +2.5 Volts monitor |  |
| +5 Volts monitor |  |
| _ROLL_ROT |  |
| _Roll_DEC |  |
| _Roll_RA |  |
| Veto Counter |  |