| Param | Original file | Final file |
|---|---|---|
| Filename | modeM0/AS1A10_094T31_9000004568cztM0_level2_bc.evt | modeM0/AS1A10_094T31_9000004568cztM0_level2_quad_clean.evt |
| Size (bytes) | 233,925,120 | 104,592,960 |
| Size | 223.1 MB | 99.7 MB |
| Events in quadrant A | 1,098,920 | 709,004 |
| Events in quadrant B | 2,612,421 | 698,003 |
| Events in quadrant C | 1,144,567 | 697,842 |
| Events in quadrant D | 1,856,415 | 687,784 |
| Mode SS | |||
|---|---|---|---|
| Quadrant | BADHDUFLAG | Total packets | Discarded packets |
| A | 0 | 108 | 0 |
| B | 0 | 108 | 0 |
| C | 0 | 108 | 0 |
| D | 0 | 108 | 0 |
| Mode M9 | |||
|---|---|---|---|
| Quadrant | BADHDUFLAG | Total packets | Discarded packets |
| A | 0 | 9 | 0 |
| B | 0 | 9 | 0 |
| C | 0 | 9 | 0 |
| D | 0 | 9 | 0 |
| Mode M0 | |||
|---|---|---|---|
| Quadrant | BADHDUFLAG | Total packets | Discarded packets |
| A | 0 | 10972 | 0 |
| B | 0 | 16485 | 0 |
| C | 0 | 11216 | 0 |
| D | 0 | 13105 | 0 |
| Quadrant | Total seconds | Saturated seconds | Saturation percentage |
|---|---|---|---|
| A | 5362 | 91 | 1.697128% |
| B | 5362 | 165 | 3.077210% |
| C | 5362 | 148 | 2.760164% |
| D | 5362 | 116 | 2.163372% |
Noise dominated data is calculated using 1-second bins in cleaned event files. If a bin has >2000 counts, and if more than 50% of those come from <1% of pixels, then it is considered to be noise-dominated and hence unusable.
| Quadrant | # 1 sec bins | Bins with >0 counts | Bins with >2000 counts | High rate bins dominated by noise | Noise dominated (total time) | Noise dominated (detector-on time) | Marked lightcurve |
|---|---|---|---|---|---|---|---|
| A | 6202 | 5361 | 0 | 0 | 0.00% | 0.00% |  |
| B | 6202 | 5362 | 1 | 1 | 0.02% | 0.02% |  |
| C | 6202 | 5362 | 0 | 0 | 0.00% | 0.00% |  |
| D | 6202 | 5361 | 7 | 7 | 0.11% | 0.13% | 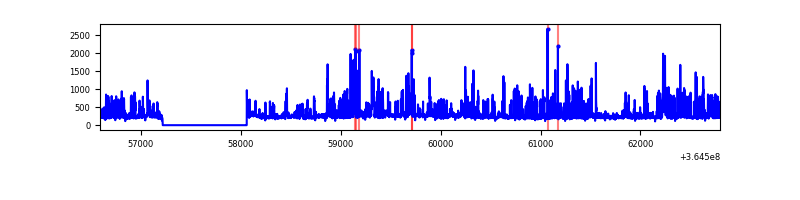 |
Top three noisy pixels from each quadrant. If the there are fewer than three noisy pixels in the level2.evt file, extra rows are filled as -1
| Pixel properties | Quadrant properties | ||||||
|---|---|---|---|---|---|---|---|
| Quadrant | DetID | PixID | Counts | Sigma | Mean | Median | Sigma |
| A | 13 | 254 | 10584 | 162.69 | 283 | 278 | 63.3 |
| A | 0 | 226 | 1825 | 24.42 | 283 | 278 | 63.3 |
| A | 12 | 194 | 1774 | 23.62 | 283 | 278 | 63.3 |
| B | 6 | 159 | 1389399 | 24720.69 | 280 | 274 | 56.2 |
| B | 12 | 1 | 86732 | 1538.6 | 280 | 274 | 56.2 |
| B | 0 | 190 | 21339 | 374.87 | 280 | 274 | 56.2 |
| C | 3 | 233 | 49733 | 716.78 | 276 | 275 | 69.0 |
| C | 14 | 254 | 10906 | 154.07 | 276 | 275 | 69.0 |
| C | 2 | 114 | 10100 | 142.39 | 276 | 275 | 69.0 |
| D | 8 | 195 | 408263 | 5991.1 | 282 | 273 | 68.1 |
| D | 12 | 218 | 151804 | 2225.15 | 282 | 273 | 68.1 |
| D | 10 | 203 | 47233 | 689.58 | 282 | 273 | 68.1 |
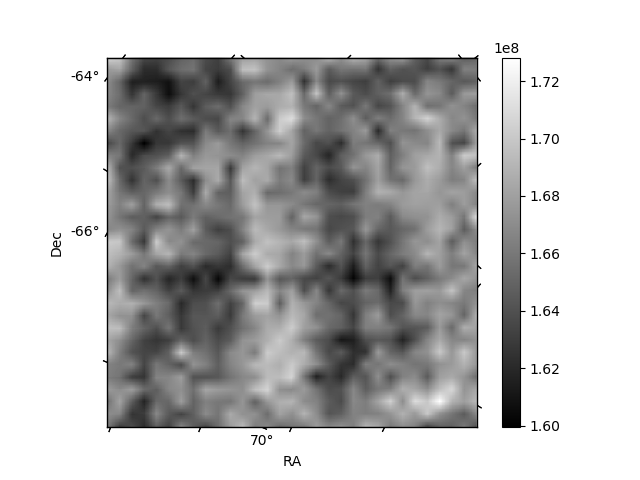
Histogram calculated using DETX and DETY for each event in the final _common_clean file
| Quadrant A |  |
 |
Quadrant B |
|---|---|---|---|
| Quadrant D |  |
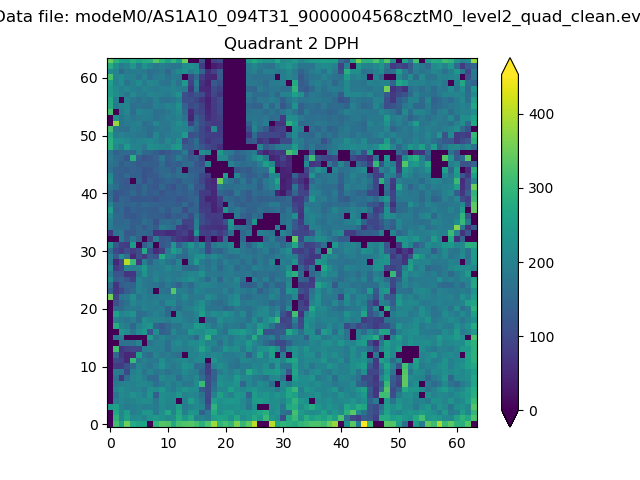 |
Quadrant C |
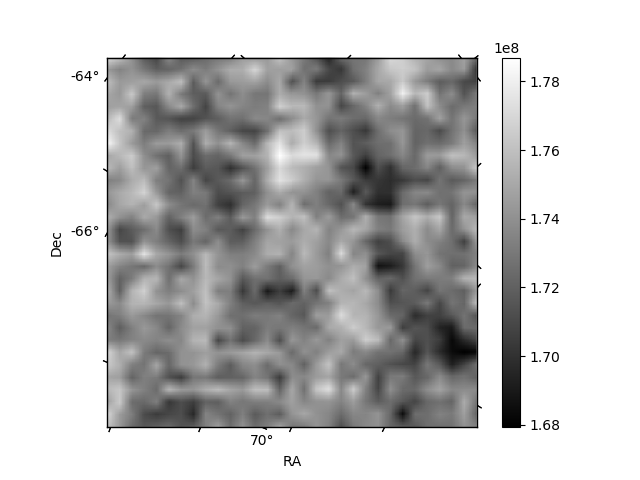
| Plot type | Count rate plots | Images |
|---|---|---|
| Comparison with Poisson distribution Blue bars denote a histogram of data divided into 1 sec bins. Red curve is a Poisson curve with rate = median count rate of data. |
 |
 |
| Quadrant-wise count rates Data is divided into 100 sec bins |
 |
|
| Module-wise count rates for Quadrant A Data is divided into 100 sec bins |
 |
 |
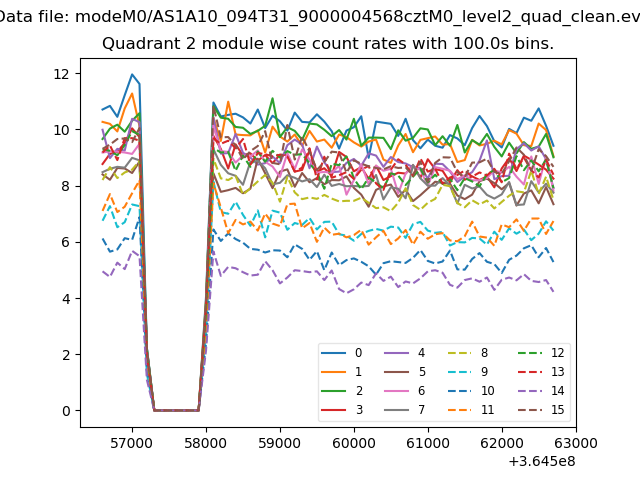
| Module-wise count rates for Quadrant B Data is divided into 100 sec bins |
 |
 |
| Module-wise count rates for Quadrant C Data is divided into 100 sec bins |
 |
 |
| Module-wise count rates for Quadrant D Data is divided into 100 sec bins |
 |
 |
| Parameter | Plot |
|---|---|
| CZT HV Monitor |  |
| D_VDD | 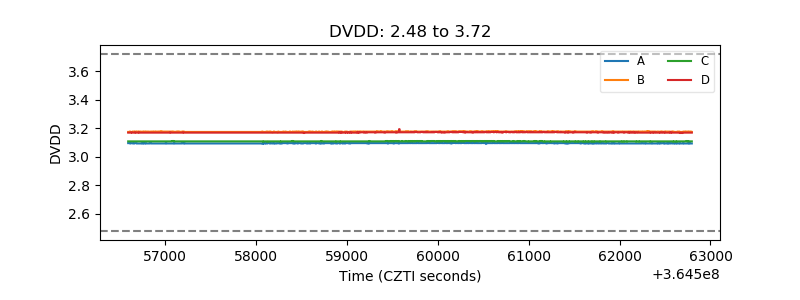 |
| Temperature 1 |  |
| Veto HV Monitor |  |
| Veto LLD |  |
| Alpha Counter | 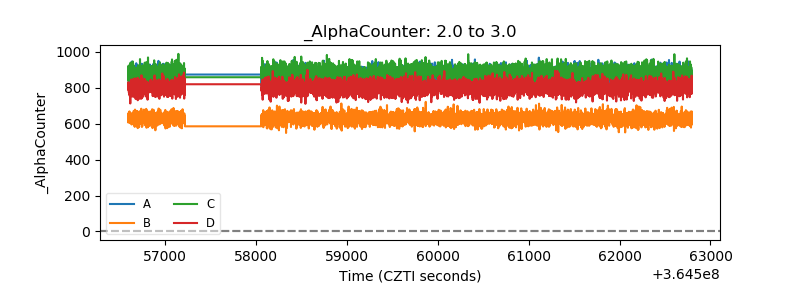 |
| _CPM_Rate |  |
| CZT Counter |  |
| +2.5 Volts monitor |  |
| +5 Volts monitor |  |
| _ROLL_ROT |  |
| _Roll_DEC |  |
| _Roll_RA |  |
| Veto Counter | 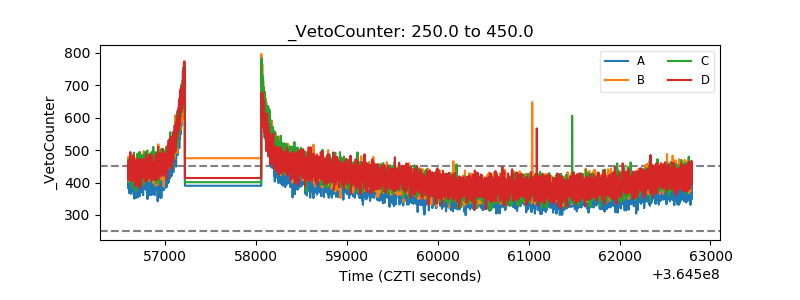 |