| Param | Original file | Final file |
|---|---|---|
| Filename | modeM0/AS1A10_094T28_9000004578cztM0_level2_bc.evt | modeM0/AS1A10_094T28_9000004578cztM0_level2_quad_clean.evt |
| Size (bytes) | 358,464,960 | 146,655,360 |
| Size | 341.9 MB | 139.9 MB |
| Events in quadrant A | 1,565,776 | 1,007,519 |
| Events in quadrant B | 4,284,698 | 942,156 |
| Events in quadrant C | 1,639,424 | 983,552 |
| Events in quadrant D | 2,821,805 | 960,075 |
| Mode M9 | |||
|---|---|---|---|
| Quadrant | BADHDUFLAG | Total packets | Discarded packets |
| A | 0 | 11 | 0 |
| B | 0 | 11 | 0 |
| C | 0 | 11 | 0 |
| D | 0 | 11 | 0 |
| Mode M0 | |||
|---|---|---|---|
| Quadrant | BADHDUFLAG | Total packets | Discarded packets |
| A | 0 | 16013 | 0 |
| B | 0 | 27547 | 0 |
| C | 0 | 16455 | 0 |
| D | 0 | 19893 | 0 |
| Mode SS | |||
|---|---|---|---|
| Quadrant | BADHDUFLAG | Total packets | Discarded packets |
| A | 0 | 162 | 0 |
| B | 0 | 162 | 0 |
| C | 0 | 162 | 0 |
| D | 0 | 162 | 0 |
| Quadrant | Total seconds | Saturated seconds | Saturation percentage |
|---|---|---|---|
| A | 7889 | 61 | 0.773229% |
| B | 7889 | 793 | 10.051971% |
| C | 7889 | 159 | 2.015465% |
| D | 7889 | 122 | 1.546457% |
Noise dominated data is calculated using 1-second bins in cleaned event files. If a bin has >2000 counts, and if more than 50% of those come from <1% of pixels, then it is considered to be noise-dominated and hence unusable.
| Quadrant | # 1 sec bins | Bins with >0 counts | Bins with >2000 counts | High rate bins dominated by noise | Noise dominated (total time) | Noise dominated (detector-on time) | Marked lightcurve |
|---|---|---|---|---|---|---|---|
| A | 8558 | 7888 | 0 | 0 | 0.00% | 0.00% |  |
| B | 8558 | 7886 | 0 | 0 | 0.00% | 0.00% |  |
| C | 8558 | 7888 | 1 | 1 | 0.01% | 0.01% |  |
| D | 8558 | 7887 | 10 | 10 | 0.12% | 0.13% |  |
Top three noisy pixels from each quadrant. If the there are fewer than three noisy pixels in the level2.evt file, extra rows are filled as -1
| Pixel properties | Quadrant properties | ||||||
|---|---|---|---|---|---|---|---|
| Quadrant | DetID | PixID | Counts | Sigma | Mean | Median | Sigma |
| A | 13 | 254 | 16106 | 174.39 | 403 | 395 | 90.1 |
| A | 12 | 194 | 2903 | 27.84 | 403 | 395 | 90.1 |
| A | 12 | 16 | 2756 | 26.21 | 403 | 395 | 90.1 |
| B | 6 | 159 | 2064786 | 27051.1 | 380 | 371 | 76.3 |
| B | 12 | 1 | 598817 | 7841.75 | 380 | 371 | 76.3 |
| B | 4 | 80 | 87568 | 1142.59 | 380 | 371 | 76.3 |
| C | 3 | 233 | 91794 | 955.04 | 391 | 388 | 95.7 |
| C | 2 | 114 | 14922 | 151.86 | 391 | 388 | 95.7 |
| C | 14 | 254 | 13200 | 133.86 | 391 | 388 | 95.7 |
| D | 8 | 195 | 665148 | 7080.46 | 398 | 385 | 93.9 |
| D | 1 | 52 | 221662 | 2356.84 | 398 | 385 | 93.9 |
| D | 12 | 218 | 115962 | 1231.02 | 398 | 385 | 93.9 |
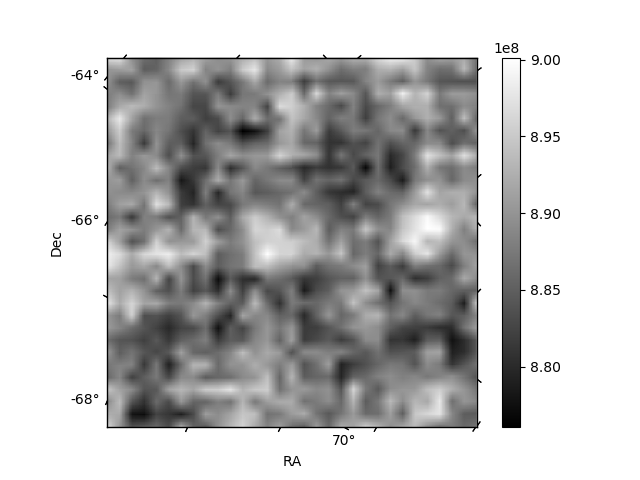
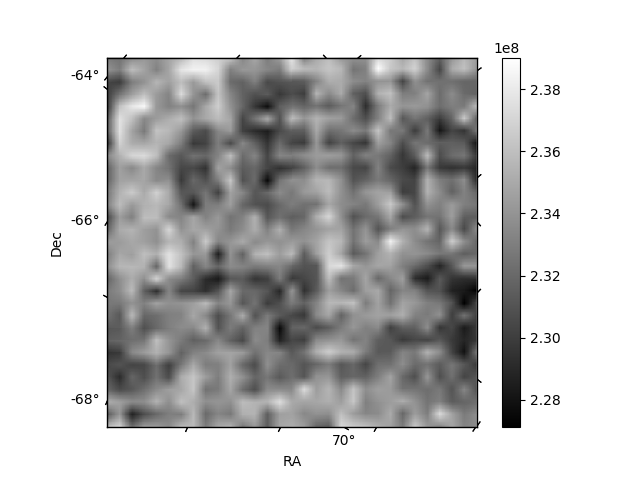
Histogram calculated using DETX and DETY for each event in the final _common_clean file
| Quadrant A |  |
 |
Quadrant B |
|---|---|---|---|
| Quadrant D |  |
 |
Quadrant C |
| Plot type | Count rate plots | Images |
|---|---|---|
| Comparison with Poisson distribution Blue bars denote a histogram of data divided into 1 sec bins. Red curve is a Poisson curve with rate = median count rate of data. |
 |
 |
| Quadrant-wise count rates Data is divided into 100 sec bins |
 |
|
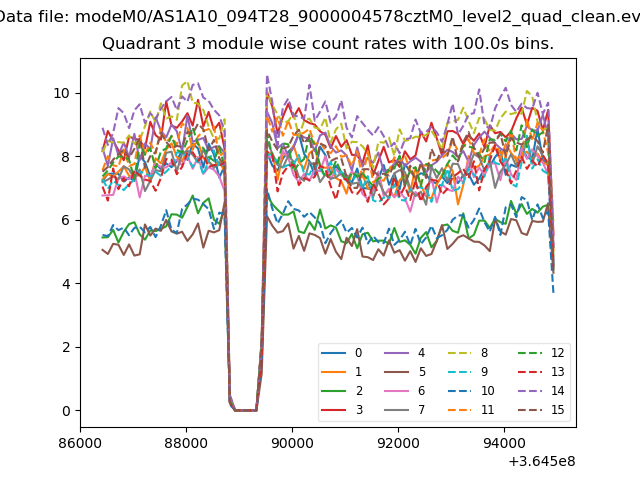
| Module-wise count rates for Quadrant A Data is divided into 100 sec bins |
 |
 |
| Module-wise count rates for Quadrant B Data is divided into 100 sec bins |
 |
 |
| Module-wise count rates for Quadrant C Data is divided into 100 sec bins |
 |
 |
| Module-wise count rates for Quadrant D Data is divided into 100 sec bins |
 |
 |
| Parameter | Plot |
|---|---|
| CZT HV Monitor |  |
| D_VDD | 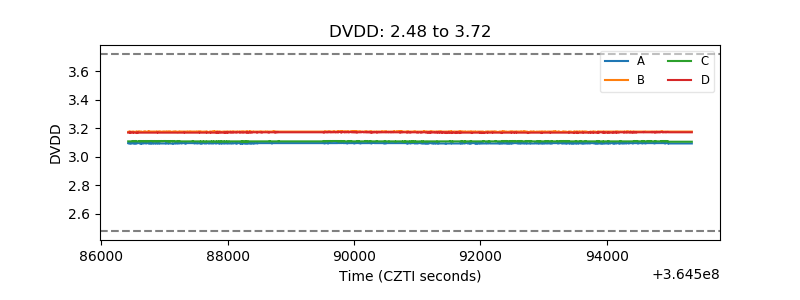 |
| Temperature 1 |  |
| Veto HV Monitor |  |
| Veto LLD | 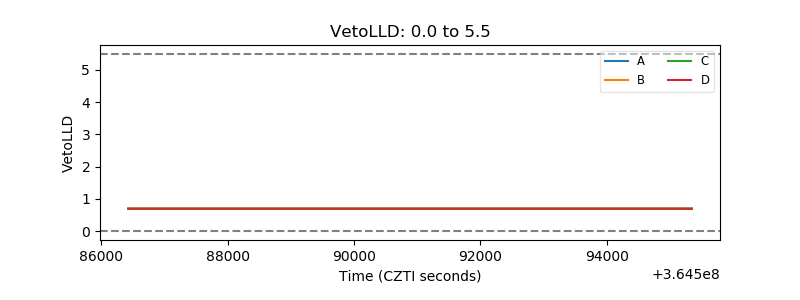 |
| Alpha Counter |  |
| _CPM_Rate |  |
| CZT Counter | 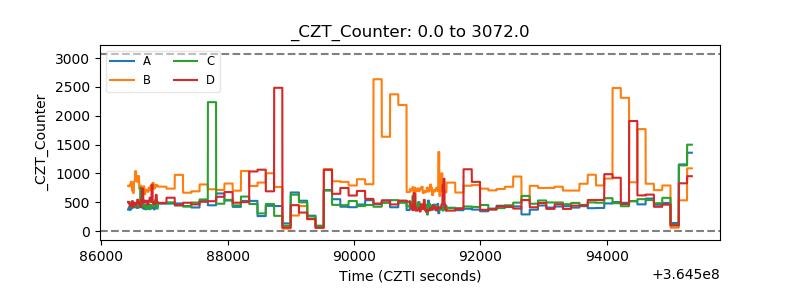 |
| +2.5 Volts monitor |  |
| +5 Volts monitor | 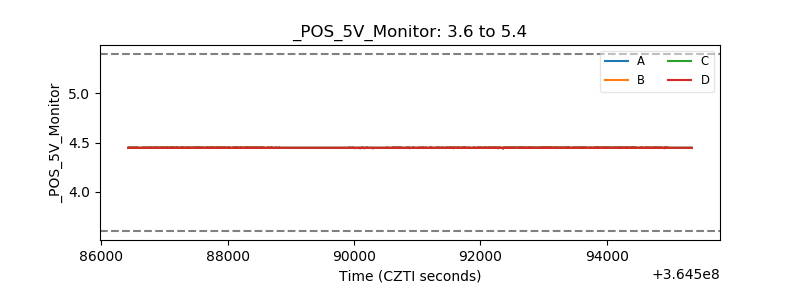 |
| _ROLL_ROT |  |
| _Roll_DEC |  |
| _Roll_RA | 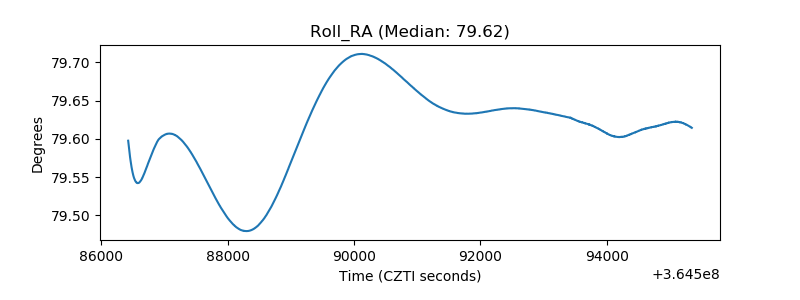 |
| Veto Counter | 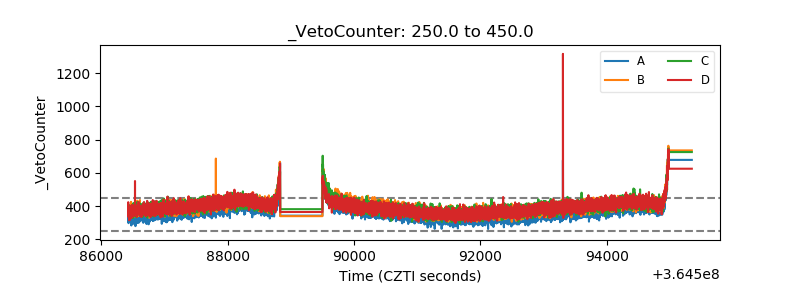 |