| Param | Original file | Final file |
|---|---|---|
| Filename | modeM0/AS1A10_094T25_9000004576cztM0_level2_bc.evt | modeM0/AS1A10_094T25_9000004576cztM0_level2_quad_clean.evt |
| Size (bytes) | 275,091,840 | 89,755,200 |
| Size | 262.3 MB | 85.6 MB |
| Events in quadrant A | 970,596 | 624,133 |
| Events in quadrant B | 3,119,008 | 551,613 |
| Events in quadrant C | 1,092,675 | 609,498 |
| Events in quadrant D | 2,808,759 | 589,578 |
| Mode M9 | |||
|---|---|---|---|
| Quadrant | BADHDUFLAG | Total packets | Discarded packets |
| A | 0 | 5 | 0 |
| B | 0 | 5 | 0 |
| C | 0 | 5 | 0 |
| D | 0 | 5 | 0 |
| Mode M0 | |||
|---|---|---|---|
| Quadrant | BADHDUFLAG | Total packets | Discarded packets |
| A | 0 | 10012 | 0 |
| B | 0 | 19230 | 0 |
| C | 0 | 10666 | 0 |
| D | 0 | 15907 | 0 |
| Mode SS | |||
|---|---|---|---|
| Quadrant | BADHDUFLAG | Total packets | Discarded packets |
| A | 0 | 98 | 0 |
| B | 0 | 98 | 0 |
| C | 0 | 98 | 0 |
| D | 0 | 98 | 0 |
| Quadrant | Total seconds | Saturated seconds | Saturation percentage |
|---|---|---|---|
| A | 4894 | 86 | 1.757254% |
| B | 4894 | 980 | 20.024520% |
| C | 4894 | 153 | 3.126277% |
| D | 4894 | 198 | 4.045770% |
Noise dominated data is calculated using 1-second bins in cleaned event files. If a bin has >2000 counts, and if more than 50% of those come from <1% of pixels, then it is considered to be noise-dominated and hence unusable.
| Quadrant | # 1 sec bins | Bins with >0 counts | Bins with >2000 counts | High rate bins dominated by noise | Noise dominated (total time) | Noise dominated (detector-on time) | Marked lightcurve |
|---|---|---|---|---|---|---|---|
| A | 5334 | 4893 | 0 | 0 | 0.00% | 0.00% |  |
| B | 5334 | 4893 | 9 | 9 | 0.17% | 0.18% |  |
| C | 5334 | 4894 | 0 | 0 | 0.00% | 0.00% |  |
| D | 5334 | 4893 | 11 | 11 | 0.21% | 0.22% | 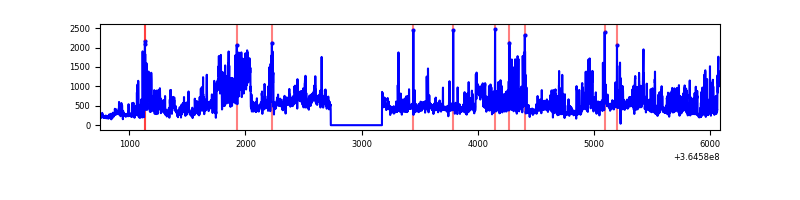 |
Top three noisy pixels from each quadrant. If the there are fewer than three noisy pixels in the level2.evt file, extra rows are filled as -1
| Pixel properties | Quadrant properties | ||||||
|---|---|---|---|---|---|---|---|
| Quadrant | DetID | PixID | Counts | Sigma | Mean | Median | Sigma |
| A | 13 | 254 | 10169 | 175.64 | 249 | 244 | 56.5 |
| A | 12 | 16 | 3469 | 57.07 | 249 | 244 | 56.5 |
| A | 12 | 194 | 2165 | 33.99 | 249 | 244 | 56.5 |
| B | 6 | 159 | 1205170 | 26107.26 | 224 | 219 | 46.2 |
| B | 12 | 1 | 919053 | 19908.06 | 224 | 219 | 46.2 |
| B | 5 | 172 | 36572 | 787.65 | 224 | 219 | 46.2 |
| C | 3 | 233 | 131558 | 2174.17 | 242 | 240 | 60.4 |
| C | 14 | 254 | 9719 | 156.94 | 242 | 240 | 60.4 |
| C | 2 | 114 | 9377 | 151.28 | 242 | 240 | 60.4 |
| D | 1 | 52 | 712685 | 11934.58 | 246 | 238 | 59.7 |
| D | 12 | 218 | 505561 | 8464.93 | 246 | 238 | 59.7 |
| D | 8 | 195 | 426852 | 7146.44 | 246 | 238 | 59.7 |
Histogram calculated using DETX and DETY for each event in the final _common_clean file
| Quadrant A |  |
 |
Quadrant B |
|---|---|---|---|
| Quadrant D |  |
 |
Quadrant C |
| Plot type | Count rate plots | Images |
|---|---|---|
| Comparison with Poisson distribution Blue bars denote a histogram of data divided into 1 sec bins. Red curve is a Poisson curve with rate = median count rate of data. |
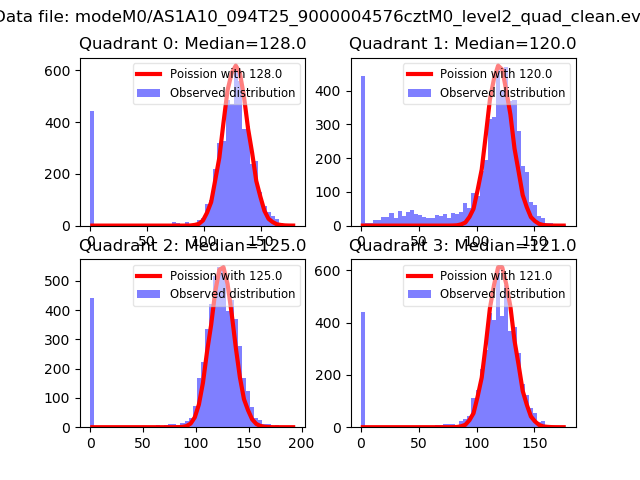 |
 |
| Quadrant-wise count rates Data is divided into 100 sec bins |
 |
|
| Module-wise count rates for Quadrant A Data is divided into 100 sec bins |
 |
 |
| Module-wise count rates for Quadrant B Data is divided into 100 sec bins |
 |
 |
| Module-wise count rates for Quadrant C Data is divided into 100 sec bins |
 |
 |
| Module-wise count rates for Quadrant D Data is divided into 100 sec bins |
 |
 |
| Parameter | Plot |
|---|---|
| CZT HV Monitor | 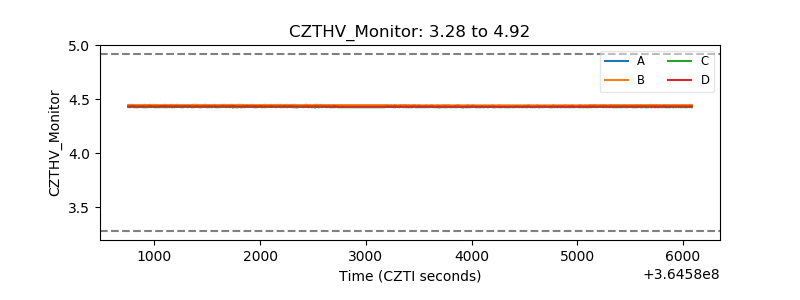 |
| D_VDD |  |
| Temperature 1 |  |
| Veto HV Monitor |  |
| Veto LLD |  |
| Alpha Counter |  |
| _CPM_Rate |  |
| CZT Counter |  |
| +2.5 Volts monitor |  |
| +5 Volts monitor |  |
| _ROLL_ROT |  |
| _Roll_DEC |  |
| _Roll_RA |  |
| Veto Counter |  |