| Param | Original file | Final file |
|---|---|---|
| Filename | modeM0/AS1T04_026T01_9000004560cztM0_level2_bc.evt | modeM0/AS1T04_026T01_9000004560cztM0_level2_quad_clean.evt |
| Size (bytes) | 950,656,320 | 273,928,320 |
| Size | 906.6 MB | 261.2 MB |
| Events in quadrant A | 4,292,675 | 1,752,074 |
| Events in quadrant B | 9,970,359 | 1,751,527 |
| Events in quadrant C | 5,264,015 | 1,688,268 |
| Events in quadrant D | 7,813,438 | 1,643,649 |
| Mode SS | |||
|---|---|---|---|
| Quadrant | BADHDUFLAG | Total packets | Discarded packets |
| A | 0 | 430 | 0 |
| B | 0 | 430 | 0 |
| C | 0 | 430 | 0 |
| D | 0 | 430 | 0 |
| Mode M9 | |||
|---|---|---|---|
| Quadrant | BADHDUFLAG | Total packets | Discarded packets |
| A | 0 | 12 | 0 |
| B | 0 | 12 | 0 |
| C | 0 | 12 | 0 |
| D | 0 | 12 | 0 |
| Mode M0 | |||
|---|---|---|---|
| Quadrant | BADHDUFLAG | Total packets | Discarded packets |
| A | 0 | 44057 | 0 |
| B | 0 | 64498 | 0 |
| C | 0 | 48629 | 0 |
| D | 0 | 54330 | 0 |
| Quadrant | Total seconds | Saturated seconds | Saturation percentage |
|---|---|---|---|
| A | 21227 | 621 | 2.925519% |
| B | 21228 | 933 | 4.395138% |
| C | 21228 | 1092 | 5.144149% |
| D | 21228 | 943 | 4.442246% |
Noise dominated data is calculated using 1-second bins in cleaned event files. If a bin has >2000 counts, and if more than 50% of those come from <1% of pixels, then it is considered to be noise-dominated and hence unusable.
| Quadrant | # 1 sec bins | Bins with >0 counts | Bins with >2000 counts | High rate bins dominated by noise | Noise dominated (total time) | Noise dominated (detector-on time) | Marked lightcurve |
|---|---|---|---|---|---|---|---|
| A | 22412 | 21225 | 0 | 0 | 0.00% | 0.00% |  |
| B | 22413 | 21228 | 0 | 0 | 0.00% | 0.00% |  |
| C | 22413 | 21226 | 36 | 36 | 0.16% | 0.17% |  |
| D | 22413 | 21226 | 163 | 163 | 0.73% | 0.77% |  |
Top three noisy pixels from each quadrant. If the there are fewer than three noisy pixels in the level2.evt file, extra rows are filled as -1
| Pixel properties | Quadrant properties | ||||||
|---|---|---|---|---|---|---|---|
| Quadrant | DetID | PixID | Counts | Sigma | Mean | Median | Sigma |
| A | 13 | 254 | 31387 | 125.41 | 1111 | 1092 | 241.6 |
| A | 12 | 194 | 7138 | 25.03 | 1111 | 1092 | 241.6 |
| A | 0 | 226 | 6889 | 24.0 | 1111 | 1092 | 241.6 |
| B | 6 | 159 | 5552084 | 25792.19 | 1111 | 1081 | 215.2 |
| B | 0 | 190 | 75319 | 344.94 | 1111 | 1081 | 215.2 |
| B | 4 | 80 | 36738 | 165.68 | 1111 | 1081 | 215.2 |
| C | 3 | 233 | 761150 | 2949.04 | 1067 | 1056 | 257.7 |
| C | 10 | 22 | 327453 | 1266.37 | 1067 | 1056 | 257.7 |
| C | 2 | 114 | 38983 | 147.15 | 1067 | 1056 | 257.7 |
| D | 8 | 195 | 2247352 | 8842.24 | 1091 | 1051 | 254.0 |
| D | 12 | 218 | 1153325 | 4535.76 | 1091 | 1051 | 254.0 |
| D | 2 | 250 | 150713 | 589.12 | 1091 | 1051 | 254.0 |
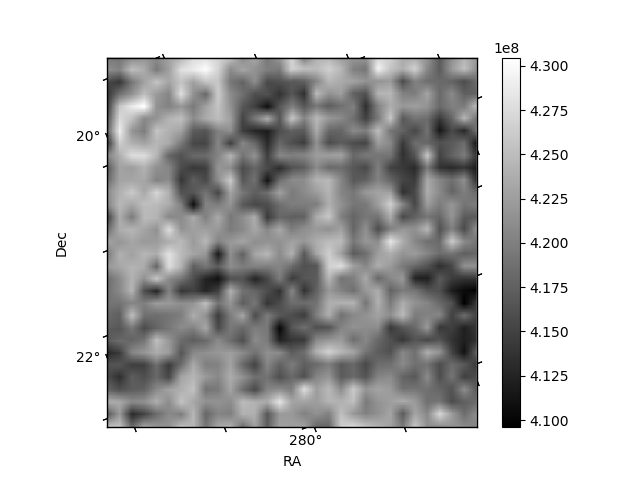
Histogram calculated using DETX and DETY for each event in the final _common_clean file
| Quadrant A |  |
 |
Quadrant B |
|---|---|---|---|
| Quadrant D |  |
 |
Quadrant C |
| Plot type | Count rate plots | Images |
|---|---|---|
| Comparison with Poisson distribution Blue bars denote a histogram of data divided into 1 sec bins. Red curve is a Poisson curve with rate = median count rate of data. |
 |
 |
| Quadrant-wise count rates Data is divided into 100 sec bins |
 |
|
| Module-wise count rates for Quadrant A Data is divided into 100 sec bins |
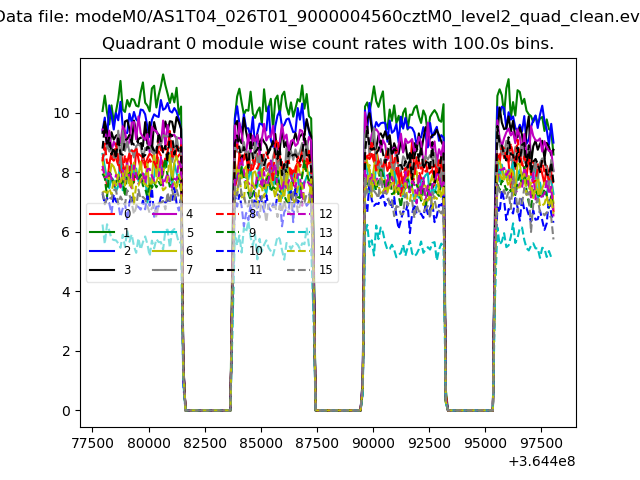 |
 |
| Module-wise count rates for Quadrant B Data is divided into 100 sec bins |
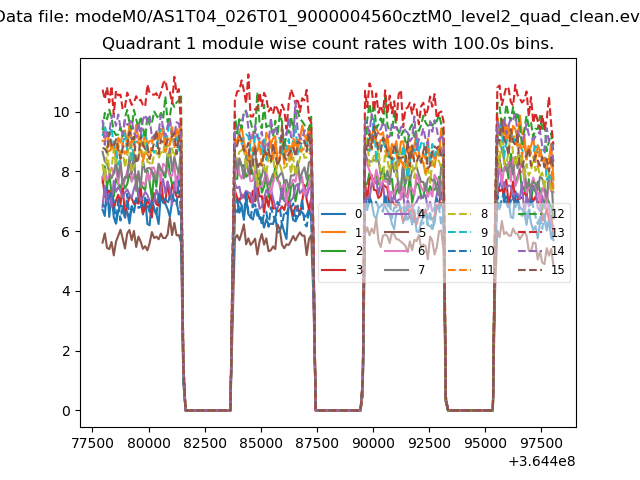 |
 |
| Module-wise count rates for Quadrant C Data is divided into 100 sec bins |
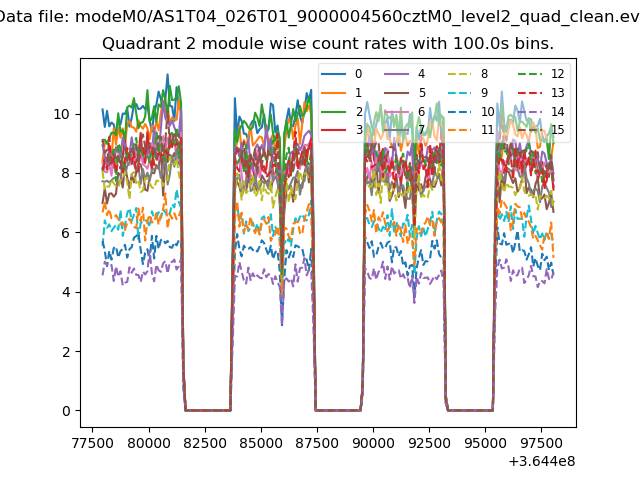 |
 |
| Module-wise count rates for Quadrant D Data is divided into 100 sec bins |
 |
 |
| Parameter | Plot |
|---|---|
| CZT HV Monitor |  |
| D_VDD |  |
| Temperature 1 | 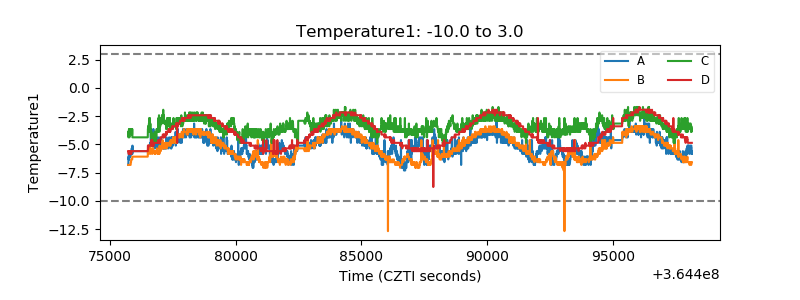 |
| Veto HV Monitor |  |
| Veto LLD |  |
| Alpha Counter |  |
| _CPM_Rate | 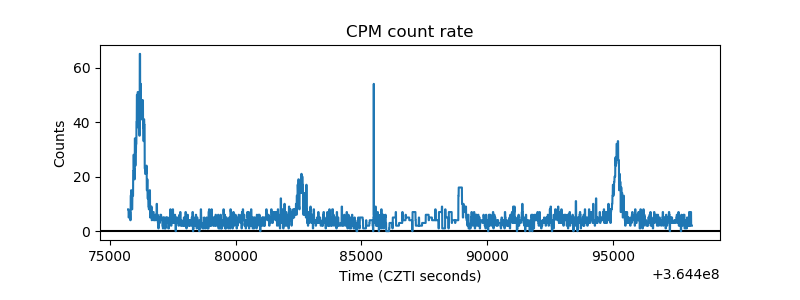 |
| CZT Counter |  |
| +2.5 Volts monitor |  |
| +5 Volts monitor |  |
| _ROLL_ROT |  |
| _Roll_DEC |  |
| _Roll_RA |  |
| Veto Counter | 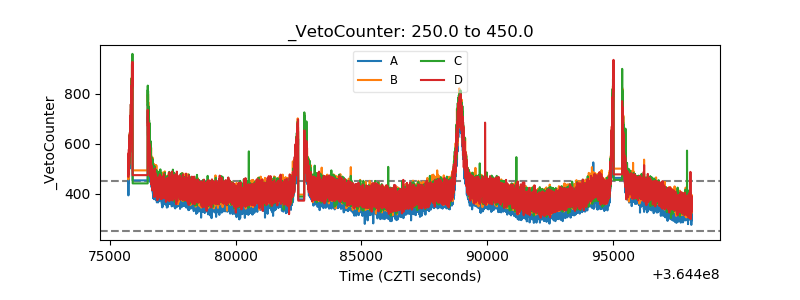 |