| Param | Original file | Final file |
|---|---|---|
| Filename | modeM0/AS1A10_094T30_9000004566cztM0_level2_bc.evt | modeM0/AS1A10_094T30_9000004566cztM0_level2_quad_clean.evt |
| Size (bytes) | 1,693,975,680 | 661,394,880 |
| Size | 1.6 GB | 630.8 MB |
| Events in quadrant A | 7,401,527 | 4,761,366 |
| Events in quadrant B | 20,376,511 | 3,742,533 |
| Events in quadrant C | 7,742,211 | 4,713,889 |
| Events in quadrant D | 13,572,631 | 4,589,110 |
| Mode M9 | |||
|---|---|---|---|
| Quadrant | BADHDUFLAG | Total packets | Discarded packets |
| A | 0 | 76 | 0 |
| B | 0 | 76 | 0 |
| C | 0 | 76 | 0 |
| D | 0 | 76 | 0 |
| Mode M0 | |||
|---|---|---|---|
| Quadrant | BADHDUFLAG | Total packets | Discarded packets |
| A | 0 | 67295 | 0 |
| B | 0 | 139117 | 0 |
| C | 0 | 70350 | 0 |
| D | 0 | 88285 | 0 |
| Mode SS | |||
|---|---|---|---|
| Quadrant | BADHDUFLAG | Total packets | Discarded packets |
| A | 0 | 660 | 0 |
| B | 0 | 660 | 0 |
| C | 0 | 660 | 0 |
| D | 0 | 660 | 0 |
| Quadrant | Total seconds | Saturated seconds | Saturation percentage |
|---|---|---|---|
| A | 32373 | 134 | 0.413925% |
| B | 32373 | 9491 | 29.317641% |
| C | 32373 | 707 | 2.183919% |
| D | 32373 | 666 | 2.057270% |
Noise dominated data is calculated using 1-second bins in cleaned event files. If a bin has >2000 counts, and if more than 50% of those come from <1% of pixels, then it is considered to be noise-dominated and hence unusable.
| Quadrant | # 1 sec bins | Bins with >0 counts | Bins with >2000 counts | High rate bins dominated by noise | Noise dominated (total time) | Noise dominated (detector-on time) | Marked lightcurve |
|---|---|---|---|---|---|---|---|
| A | 39924 | 32372 | 0 | 0 | 0.00% | 0.00% |  |
| B | 39924 | 32242 | 625 | 625 | 1.57% | 1.94% |  |
| C | 39924 | 32374 | 9 | 9 | 0.02% | 0.03% |  |
| D | 39924 | 32374 | 84 | 84 | 0.21% | 0.26% |  |
Top three noisy pixels from each quadrant. If the there are fewer than three noisy pixels in the level2.evt file, extra rows are filled as -1
| Pixel properties | Quadrant properties | ||||||
|---|---|---|---|---|---|---|---|
| Quadrant | DetID | PixID | Counts | Sigma | Mean | Median | Sigma |
| A | 13 | 254 | 57396 | 137.32 | 1913 | 1893 | 404.2 |
| A | 12 | 16 | 17098 | 37.62 | 1913 | 1893 | 404.2 |
| A | 12 | 194 | 14382 | 30.9 | 1913 | 1893 | 404.2 |
| B | 12 | 1 | 7231373 | 25438.13 | 1522 | 1495 | 284.2 |
| B | 6 | 159 | 6885077 | 24219.7 | 1522 | 1495 | 284.2 |
| B | 4 | 80 | 216970 | 758.14 | 1522 | 1495 | 284.2 |
| C | 10 | 22 | 276855 | 614.36 | 1884 | 1887 | 447.6 |
| C | 3 | 233 | 89853 | 196.54 | 1884 | 1887 | 447.6 |
| C | 2 | 114 | 60551 | 131.07 | 1884 | 1887 | 447.6 |
| D | 8 | 195 | 3754852 | 8280.57 | 1900 | 1863 | 453.2 |
| D | 12 | 218 | 1277592 | 2814.76 | 1900 | 1863 | 453.2 |
| D | 5 | 233 | 540373 | 1188.16 | 1900 | 1863 | 453.2 |
Histogram calculated using DETX and DETY for each event in the final _common_clean file
| Quadrant A | 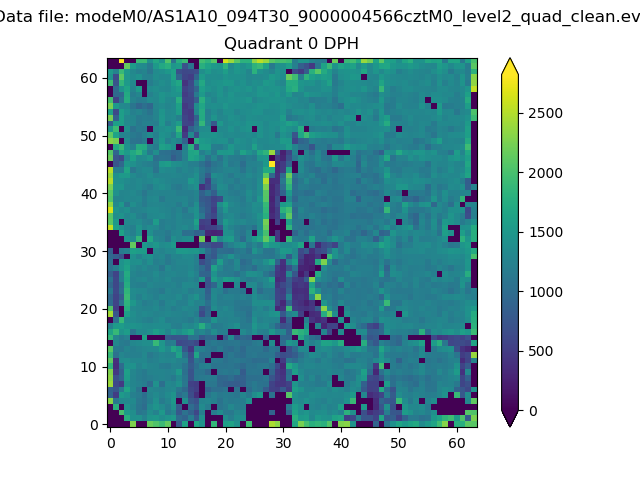 |
 |
Quadrant B |
|---|---|---|---|
| Quadrant D |  |
 |
Quadrant C |
| Plot type | Count rate plots | Images |
|---|---|---|
| Comparison with Poisson distribution Blue bars denote a histogram of data divided into 1 sec bins. Red curve is a Poisson curve with rate = median count rate of data. |
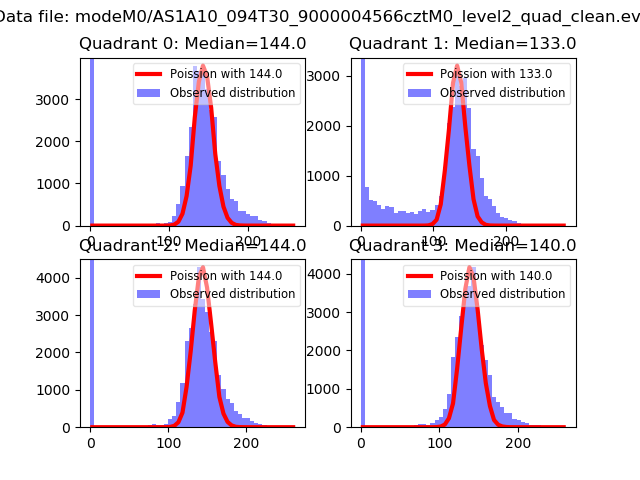 |
 |
| Quadrant-wise count rates Data is divided into 100 sec bins |
 |
|
| Module-wise count rates for Quadrant A Data is divided into 100 sec bins |
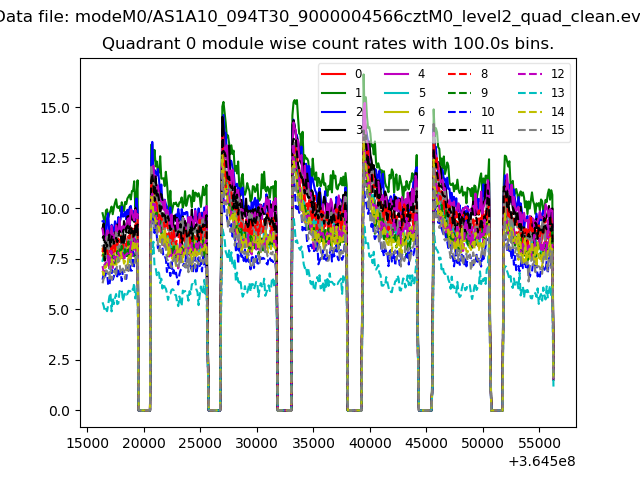 |
 |
| Module-wise count rates for Quadrant B Data is divided into 100 sec bins |
 |
 |
| Module-wise count rates for Quadrant C Data is divided into 100 sec bins |
 |
 |
| Module-wise count rates for Quadrant D Data is divided into 100 sec bins |
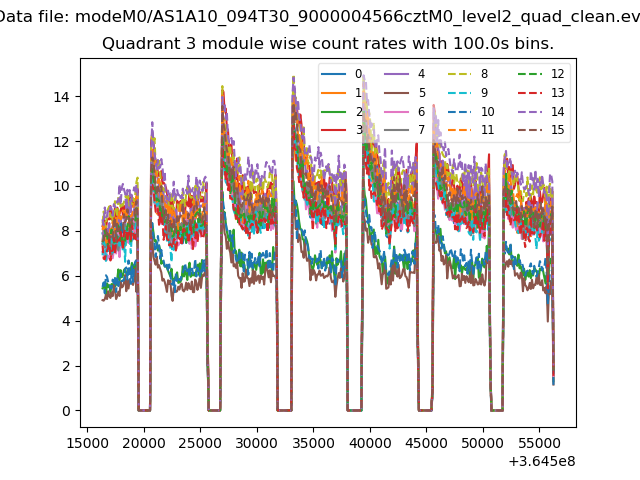 |
 |
| Parameter | Plot |
|---|---|
| CZT HV Monitor |  |
| D_VDD |  |
| Temperature 1 |  |
| Veto HV Monitor |  |
| Veto LLD |  |
| Alpha Counter |  |
| _CPM_Rate |  |
| CZT Counter |  |
| +2.5 Volts monitor |  |
| +5 Volts monitor | 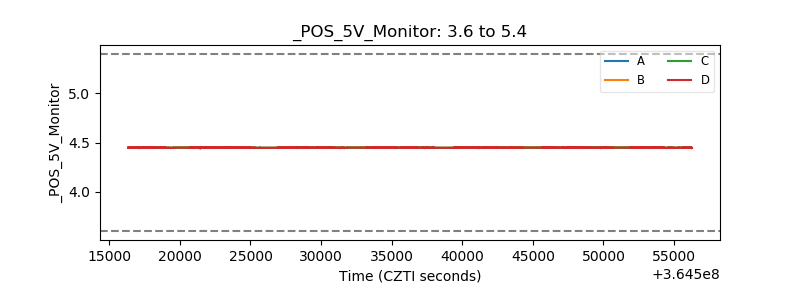 |
| _ROLL_ROT |  |
| _Roll_DEC | 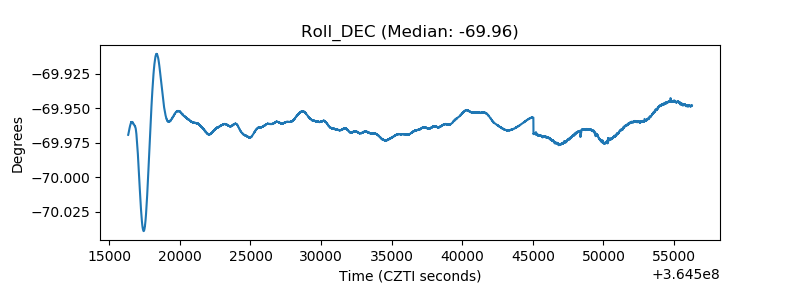 |
| _Roll_RA |  |
| Veto Counter |  |