| Param | Original file | Final file |
|---|---|---|
| Filename | modeM0/AS1T04_026T01_9000004556cztM0_level2_bc.evt | modeM0/AS1T04_026T01_9000004556cztM0_level2_quad_clean.evt |
| Size (bytes) | 3,897,455,040 | 1,099,546,560 |
| Size | 3.6 GB | 1.0 GB |
| Events in quadrant A | 18,366,219 | 7,050,255 |
| Events in quadrant B | 41,588,083 | 7,010,529 |
| Events in quadrant C | 20,183,884 | 6,827,874 |
| Events in quadrant D | 32,128,855 | 6,600,385 |
| Mode M9 | |||
|---|---|---|---|
| Quadrant | BADHDUFLAG | Total packets | Discarded packets |
| A | 0 | 136 | 0 |
| B | 0 | 136 | 0 |
| C | 0 | 136 | 0 |
| D | 0 | 136 | 0 |
| Mode M0 | |||
|---|---|---|---|
| Quadrant | BADHDUFLAG | Total packets | Discarded packets |
| A | 0 | 176874 | 0 |
| B | 0 | 259470 | 0 |
| C | 0 | 188754 | 0 |
| D | 0 | 229165 | 0 |
| Mode SS | |||
|---|---|---|---|
| Quadrant | BADHDUFLAG | Total packets | Discarded packets |
| A | 0 | 1644 | 0 |
| B | 0 | 1644 | 0 |
| C | 0 | 1644 | 0 |
| D | 0 | 1644 | 0 |
| Quadrant | Total seconds | Saturated seconds | Saturation percentage |
|---|---|---|---|
| A | 85108 | 1182 | 1.388824% |
| B | 85110 | 2303 | 2.705910% |
| C | 85111 | 2892 | 3.397916% |
| D | 85107 | 4923 | 5.784483% |
Noise dominated data is calculated using 1-second bins in cleaned event files. If a bin has >2000 counts, and if more than 50% of those come from <1% of pixels, then it is considered to be noise-dominated and hence unusable.
| Quadrant | # 1 sec bins | Bins with >0 counts | Bins with >2000 counts | High rate bins dominated by noise | Noise dominated (total time) | Noise dominated (detector-on time) | Marked lightcurve |
|---|---|---|---|---|---|---|---|
| A | 99189 | 85114 | 0 | 0 | 0.00% | 0.00% |  |
| B | 99189 | 85115 | 11 | 11 | 0.01% | 0.01% |  |
| C | 99189 | 85113 | 9 | 9 | 0.01% | 0.01% |  |
| D | 99189 | 85114 | 294 | 294 | 0.30% | 0.35% |  |
Top three noisy pixels from each quadrant. If the there are fewer than three noisy pixels in the level2.evt file, extra rows are filled as -1
| Pixel properties | Quadrant properties | ||||||
|---|---|---|---|---|---|---|---|
| Quadrant | DetID | PixID | Counts | Sigma | Mean | Median | Sigma |
| A | 13 | 254 | 133874 | 128.33 | 4739 | 4667 | 1006.8 |
| A | 12 | 16 | 73889 | 68.75 | 4739 | 4667 | 1006.8 |
| A | 12 | 194 | 40625 | 35.71 | 4739 | 4667 | 1006.8 |
| B | 6 | 159 | 22318874 | 24938.19 | 4738 | 4633 | 894.8 |
| B | 4 | 80 | 517937 | 573.66 | 4738 | 4633 | 894.8 |
| B | 0 | 190 | 306953 | 337.87 | 4738 | 4633 | 894.8 |
| C | 3 | 233 | 1343279 | 1229.68 | 4587 | 4576 | 1088.7 |
| C | 10 | 22 | 749542 | 684.29 | 4587 | 4576 | 1088.7 |
| C | 14 | 254 | 183601 | 164.44 | 4587 | 4576 | 1088.7 |
| D | 12 | 218 | 7582195 | 6827.23 | 4593 | 4481 | 1109.9 |
| D | 8 | 195 | 4768060 | 4291.81 | 4593 | 4481 | 1109.9 |
| D | 10 | 203 | 619206 | 553.84 | 4593 | 4481 | 1109.9 |
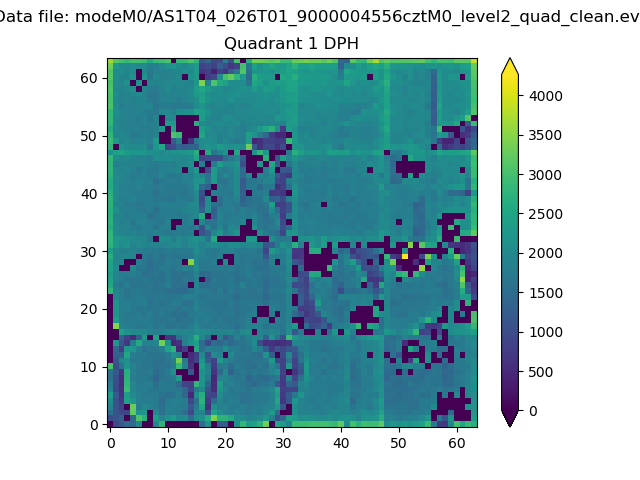
Histogram calculated using DETX and DETY for each event in the final _common_clean file
| Quadrant A |  |
 |
Quadrant B |
|---|---|---|---|
| Quadrant D |  |
 |
Quadrant C |
| Plot type | Count rate plots | Images |
|---|---|---|
| Comparison with Poisson distribution Blue bars denote a histogram of data divided into 1 sec bins. Red curve is a Poisson curve with rate = median count rate of data. |
 |
 |
| Quadrant-wise count rates Data is divided into 100 sec bins |
 |
|
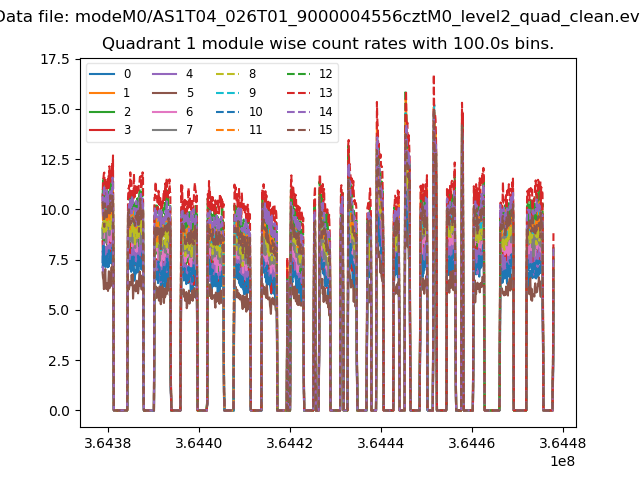
| Module-wise count rates for Quadrant A Data is divided into 100 sec bins |
 |
 |
| Module-wise count rates for Quadrant B Data is divided into 100 sec bins |
 |
 |
| Module-wise count rates for Quadrant C Data is divided into 100 sec bins |
 |
 |
| Module-wise count rates for Quadrant D Data is divided into 100 sec bins |
 |
 |
| Parameter | Plot |
|---|---|
| CZT HV Monitor |  |
| D_VDD |  |
| Temperature 1 | 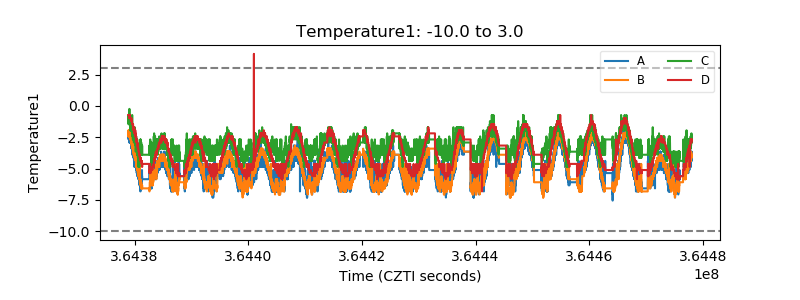 |
| Veto HV Monitor |  |
| Veto LLD |  |
| Alpha Counter |  |
| _CPM_Rate | 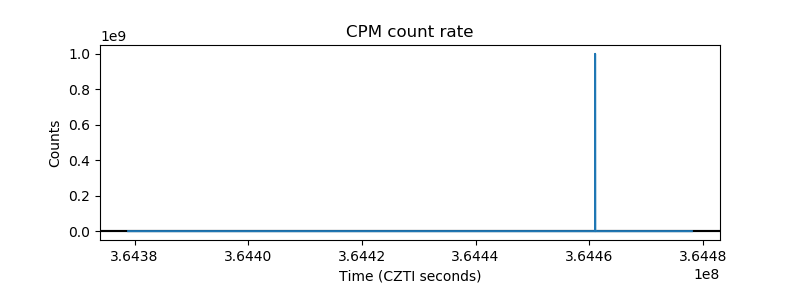 |
| CZT Counter |  |
| +2.5 Volts monitor |  |
| +5 Volts monitor |  |
| _ROLL_ROT |  |
| _Roll_DEC | 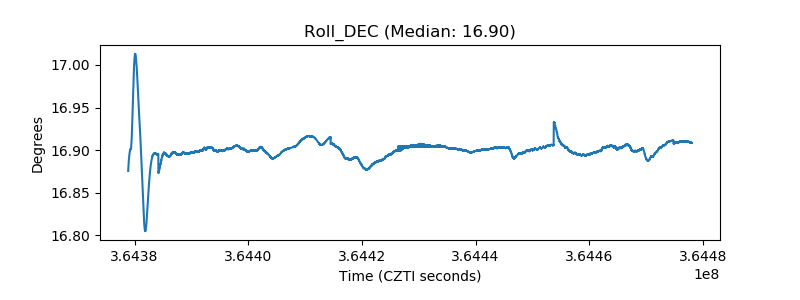 |
| _Roll_RA |  |
| Veto Counter |  |