| Param | Original file | Final file |
|---|---|---|
| Filename | modeM0/AS1A10_094T26_9000004554cztM0_level2_bc.evt | modeM0/AS1A10_094T26_9000004554cztM0_level2_quad_clean.evt |
| Size (bytes) | 276,877,440 | 137,033,280 |
| Size | 264.1 MB | 130.7 MB |
| Events in quadrant A | 1,477,398 | 948,180 |
| Events in quadrant B | 3,012,067 | 942,909 |
| Events in quadrant C | 1,528,673 | 931,805 |
| Events in quadrant D | 1,963,557 | 920,754 |
| Mode M9 | |||
|---|---|---|---|
| Quadrant | BADHDUFLAG | Total packets | Discarded packets |
| A | 0 | 26 | 0 |
| B | 0 | 26 | 0 |
| C | 0 | 26 | 0 |
| D | 0 | 26 | 0 |
| Mode SS | |||
|---|---|---|---|
| Quadrant | BADHDUFLAG | Total packets | Discarded packets |
| A | 0 | 120 | 0 |
| B | 0 | 120 | 0 |
| C | 0 | 120 | 0 |
| D | 0 | 120 | 0 |
| Mode M0 | |||
|---|---|---|---|
| Quadrant | BADHDUFLAG | Total packets | Discarded packets |
| A | 0 | 12638 | 0 |
| B | 0 | 17939 | 0 |
| C | 0 | 13470 | 0 |
| D | 0 | 14159 | 0 |
| Quadrant | Total seconds | Saturated seconds | Saturation percentage |
|---|---|---|---|
| A | 5821 | 21 | 0.360763% |
| B | 5821 | 93 | 1.597664% |
| C | 5821 | 163 | 2.800206% |
| D | 5821 | 38 | 0.652809% |
Noise dominated data is calculated using 1-second bins in cleaned event files. If a bin has >2000 counts, and if more than 50% of those come from <1% of pixels, then it is considered to be noise-dominated and hence unusable.
| Quadrant | # 1 sec bins | Bins with >0 counts | Bins with >2000 counts | High rate bins dominated by noise | Noise dominated (total time) | Noise dominated (detector-on time) | Marked lightcurve |
|---|---|---|---|---|---|---|---|
| A | 7200 | 5820 | 0 | 0 | 0.00% | 0.00% |  |
| B | 7200 | 5820 | 0 | 0 | 0.00% | 0.00% |  |
| C | 7200 | 5820 | 0 | 0 | 0.00% | 0.00% |  |
| D | 7200 | 5820 | 1 | 1 | 0.01% | 0.02% |  |
Top three noisy pixels from each quadrant. If the there are fewer than three noisy pixels in the level2.evt file, extra rows are filled as -1
| Pixel properties | Quadrant properties | ||||||
|---|---|---|---|---|---|---|---|
| Quadrant | DetID | PixID | Counts | Sigma | Mean | Median | Sigma |
| A | 13 | 254 | 10649 | 126.56 | 383 | 379 | 81.1 |
| A | 0 | 226 | 2537 | 26.59 | 383 | 379 | 81.1 |
| A | 12 | 194 | 2426 | 25.23 | 383 | 379 | 81.1 |
| B | 6 | 159 | 1482636 | 20519.61 | 379 | 373 | 72.2 |
| B | 4 | 80 | 43475 | 596.68 | 379 | 373 | 72.2 |
| B | 0 | 190 | 21716 | 295.46 | 379 | 373 | 72.2 |
| C | 0 | 10 | 30862 | 340.37 | 375 | 377 | 89.6 |
| C | 3 | 233 | 23548 | 258.71 | 375 | 377 | 89.6 |
| C | 2 | 114 | 11201 | 120.85 | 375 | 377 | 89.6 |
| D | 8 | 195 | 263888 | 3028.45 | 384 | 373 | 87.0 |
| D | 10 | 203 | 159508 | 1828.86 | 384 | 373 | 87.0 |
| D | 2 | 250 | 45724 | 521.2 | 384 | 373 | 87.0 |
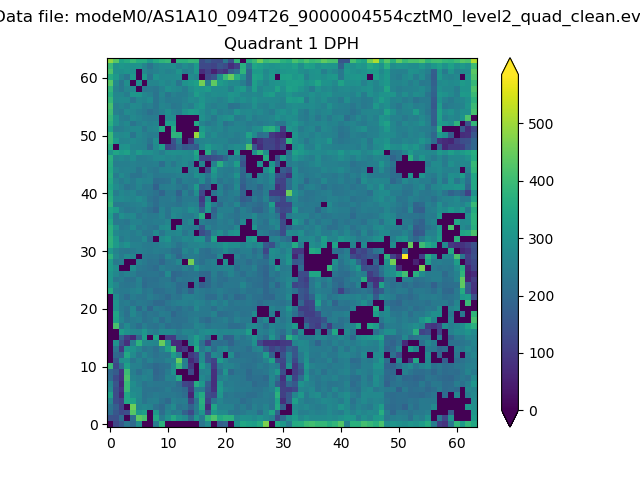
Histogram calculated using DETX and DETY for each event in the final _common_clean file
| Quadrant A |  |
 |
Quadrant B |
|---|---|---|---|
| Quadrant D |  |
 |
Quadrant C |
| Plot type | Count rate plots | Images |
|---|---|---|
| Comparison with Poisson distribution Blue bars denote a histogram of data divided into 1 sec bins. Red curve is a Poisson curve with rate = median count rate of data. |
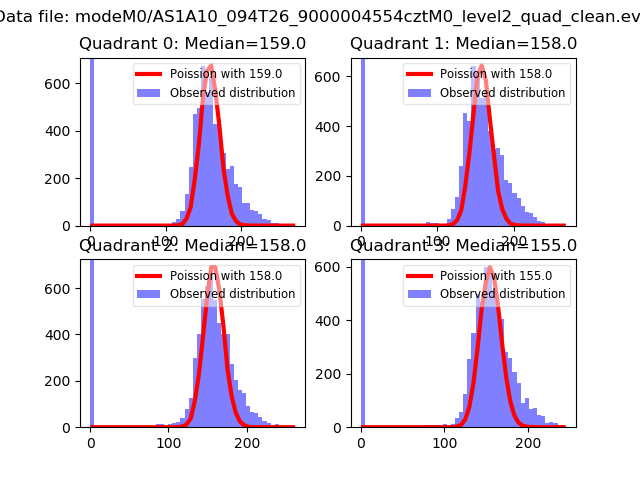 |
 |
| Quadrant-wise count rates Data is divided into 100 sec bins |
 |
|
| Module-wise count rates for Quadrant A Data is divided into 100 sec bins |
 |
 |
| Module-wise count rates for Quadrant B Data is divided into 100 sec bins |
 |
 |
| Module-wise count rates for Quadrant C Data is divided into 100 sec bins |
 |
 |
| Module-wise count rates for Quadrant D Data is divided into 100 sec bins |
 |
 |
| Parameter | Plot |
|---|---|
| CZT HV Monitor |  |
| D_VDD |  |
| Temperature 1 |  |
| Veto HV Monitor | 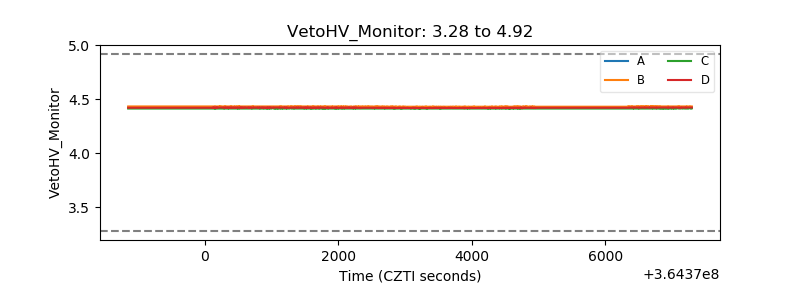 |
| Veto LLD |  |
| Alpha Counter |  |
| _CPM_Rate |  |
| CZT Counter |  |
| +2.5 Volts monitor |  |
| +5 Volts monitor |  |
| _ROLL_ROT |  |
| _Roll_DEC |  |
| _Roll_RA |  |
| Veto Counter |  |