| Param | Original file | Final file |
|---|---|---|
| Filename | modeM0/AS1T04_027T01_9000004552cztM0_level2_bc.evt | modeM0/AS1T04_027T01_9000004552cztM0_level2_quad_clean.evt |
| Size (bytes) | 1,969,496,640 | 574,876,800 |
| Size | 1.8 GB | 548.2 MB |
| Events in quadrant A | 9,671,972 | 3,679,694 |
| Events in quadrant B | 22,729,089 | 3,630,067 |
| Events in quadrant C | 10,290,520 | 3,531,867 |
| Events in quadrant D | 13,911,447 | 3,501,314 |
| Mode M9 | |||
|---|---|---|---|
| Quadrant | BADHDUFLAG | Total packets | Discarded packets |
| A | 0 | 65 | 0 |
| B | 0 | 65 | 0 |
| C | 0 | 65 | 0 |
| D | 0 | 65 | 0 |
| Mode SS | |||
|---|---|---|---|
| Quadrant | BADHDUFLAG | Total packets | Discarded packets |
| A | 0 | 908 | 0 |
| B | 0 | 908 | 0 |
| C | 0 | 908 | 0 |
| D | 0 | 908 | 0 |
| Mode M0 | |||
|---|---|---|---|
| Quadrant | BADHDUFLAG | Total packets | Discarded packets |
| A | 0 | 92633 | 0 |
| B | 0 | 138003 | 0 |
| C | 0 | 96996 | 0 |
| D | 0 | 105508 | 0 |
| Quadrant | Total seconds | Saturated seconds | Saturation percentage |
|---|---|---|---|
| A | 44713 | 319 | 0.713439% |
| B | 44737 | 1010 | 2.257639% |
| C | 44701 | 1054 | 2.357889% |
| D | 44732 | 500 | 1.117768% |
Noise dominated data is calculated using 1-second bins in cleaned event files. If a bin has >2000 counts, and if more than 50% of those come from <1% of pixels, then it is considered to be noise-dominated and hence unusable.
| Quadrant | # 1 sec bins | Bins with >0 counts | Bins with >2000 counts | High rate bins dominated by noise | Noise dominated (total time) | Noise dominated (detector-on time) | Marked lightcurve |
|---|---|---|---|---|---|---|---|
| A | 51427 | 44736 | 0 | 0 | 0.00% | 0.00% |  |
| B | 51427 | 44754 | 12 | 12 | 0.02% | 0.03% | 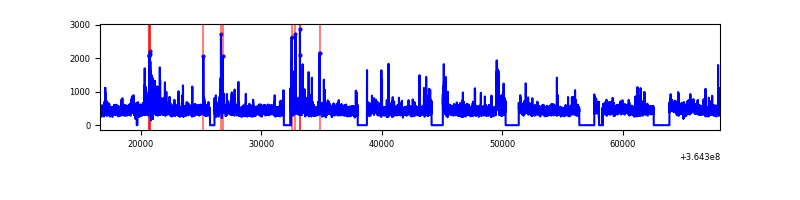 |
| C | 51427 | 44722 | 7 | 7 | 0.01% | 0.02% | 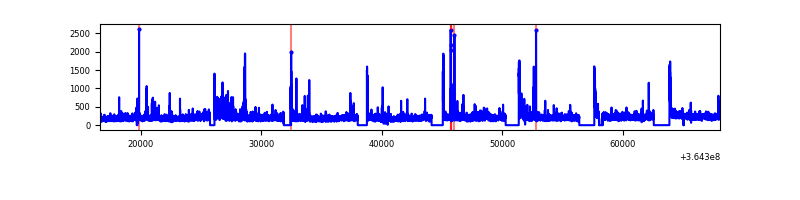 |
| D | 51427 | 44754 | 32 | 32 | 0.06% | 0.07% |  |
Top three noisy pixels from each quadrant. If the there are fewer than three noisy pixels in the level2.evt file, extra rows are filled as -1
| Pixel properties | Quadrant properties | ||||||
|---|---|---|---|---|---|---|---|
| Quadrant | DetID | PixID | Counts | Sigma | Mean | Median | Sigma |
| A | 5 | 16 | 220783 | 418.3 | 2441 | 2403 | 522.1 |
| A | 13 | 254 | 88357 | 164.64 | 2441 | 2403 | 522.1 |
| A | 12 | 194 | 16718 | 27.42 | 2441 | 2403 | 522.1 |
| B | 6 | 159 | 12166945 | 26273.33 | 2445 | 2391 | 463.0 |
| B | 5 | 172 | 285643 | 611.78 | 2445 | 2391 | 463.0 |
| B | 4 | 80 | 281742 | 603.35 | 2445 | 2391 | 463.0 |
| C | 3 | 233 | 532411 | 966.28 | 2337 | 2338 | 548.6 |
| C | 0 | 10 | 497695 | 903.0 | 2337 | 2338 | 548.6 |
| C | 2 | 114 | 84444 | 149.67 | 2337 | 2338 | 548.6 |
| D | 8 | 195 | 2684597 | 4819.13 | 2386 | 2317 | 556.6 |
| D | 10 | 203 | 695111 | 1244.71 | 2386 | 2317 | 556.6 |
| D | 2 | 250 | 462680 | 827.11 | 2386 | 2317 | 556.6 |
Histogram calculated using DETX and DETY for each event in the final _common_clean file
| Quadrant A |  |
 |
Quadrant B |
|---|---|---|---|
| Quadrant D |  |
 |
Quadrant C |
| Plot type | Count rate plots | Images |
|---|---|---|
| Comparison with Poisson distribution Blue bars denote a histogram of data divided into 1 sec bins. Red curve is a Poisson curve with rate = median count rate of data. |
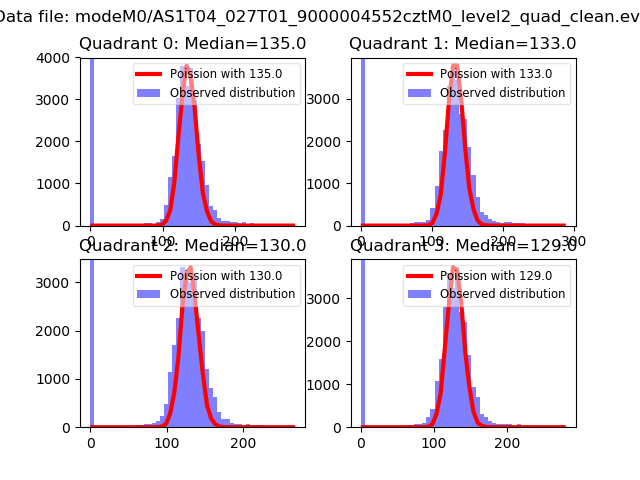 |
 |
| Quadrant-wise count rates Data is divided into 100 sec bins |
 |
|
| Module-wise count rates for Quadrant A Data is divided into 100 sec bins |
 |
 |
| Module-wise count rates for Quadrant B Data is divided into 100 sec bins |
 |
 |
| Module-wise count rates for Quadrant C Data is divided into 100 sec bins |
 |
 |
| Module-wise count rates for Quadrant D Data is divided into 100 sec bins |
 |
 |
| Parameter | Plot |
|---|---|
| CZT HV Monitor |  |
| D_VDD |  |
| Temperature 1 |  |
| Veto HV Monitor |  |
| Veto LLD | 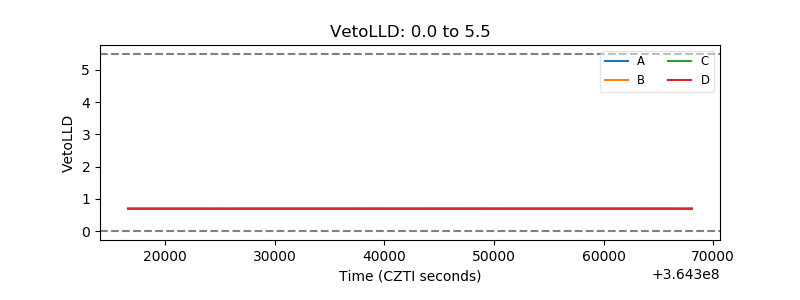 |
| Alpha Counter | 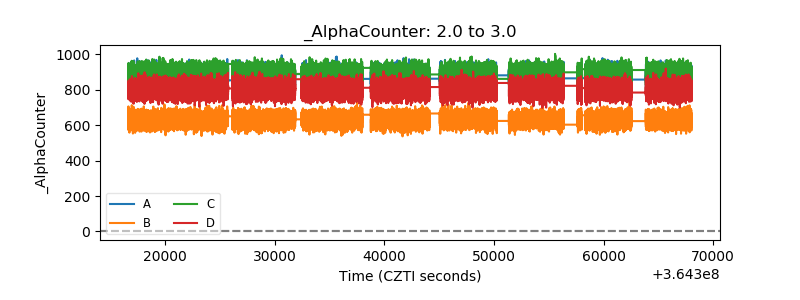 |
| _CPM_Rate |  |
| CZT Counter | 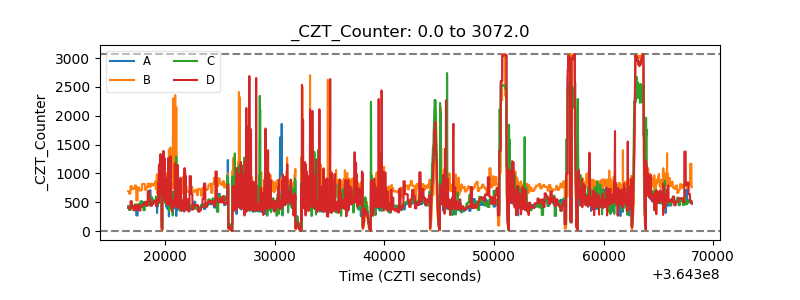 |
| +2.5 Volts monitor |  |
| +5 Volts monitor |  |
| _ROLL_ROT | 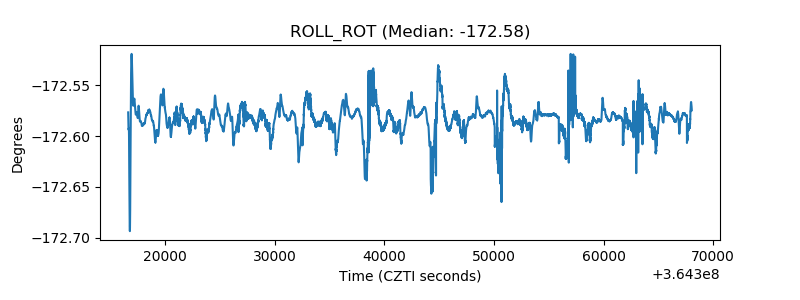 |
| _Roll_DEC |  |
| _Roll_RA |  |
| Veto Counter |  |