| Param | Original file | Final file |
|---|---|---|
| Filename | modeM0/AS1C06_006T05_9000004550cztM0_level2_bc.evt | modeM0/AS1C06_006T05_9000004550cztM0_level2_quad_clean.evt |
| Size (bytes) | 408,758,400 | 123,845,760 |
| Size | 389.8 MB | 118.1 MB |
| Events in quadrant A | 1,940,660 | 811,046 |
| Events in quadrant B | 4,909,609 | 782,520 |
| Events in quadrant C | 1,992,099 | 766,452 |
| Events in quadrant D | 2,913,848 | 762,382 |
| Mode SS | |||
|---|---|---|---|
| Quadrant | BADHDUFLAG | Total packets | Discarded packets |
| A | 0 | 186 | 0 |
| B | 0 | 188 | 0 |
| C | 0 | 186 | 0 |
| D | 0 | 186 | 0 |
| Mode M0 | |||
|---|---|---|---|
| Quadrant | BADHDUFLAG | Total packets | Discarded packets |
| A | 0 | 19345 | 0 |
| B | 0 | 29674 | 0 |
| C | 0 | 19629 | 0 |
| D | 0 | 22108 | 0 |
| Mode M9 | |||
|---|---|---|---|
| Quadrant | BADHDUFLAG | Total packets | Discarded packets |
| A | 0 | 7 | 0 |
| B | 0 | 7 | 0 |
| C | 0 | 7 | 0 |
| D | 0 | 7 | 0 |
| Quadrant | Total seconds | Saturated seconds | Saturation percentage |
|---|---|---|---|
| A | 9044 | 247 | 2.731092% |
| B | 9032 | 642 | 7.108060% |
| C | 9050 | 398 | 4.397790% |
| D | 9047 | 224 | 2.475959% |
Noise dominated data is calculated using 1-second bins in cleaned event files. If a bin has >2000 counts, and if more than 50% of those come from <1% of pixels, then it is considered to be noise-dominated and hence unusable.
| Quadrant | # 1 sec bins | Bins with >0 counts | Bins with >2000 counts | High rate bins dominated by noise | Noise dominated (total time) | Noise dominated (detector-on time) | Marked lightcurve |
|---|---|---|---|---|---|---|---|
| A | 9888 | 9052 | 1 | 1 | 0.01% | 0.01% |  |
| B | 9888 | 9040 | 5 | 5 | 0.05% | 0.06% |  |
| C | 9888 | 9065 | 1 | 1 | 0.01% | 0.01% | 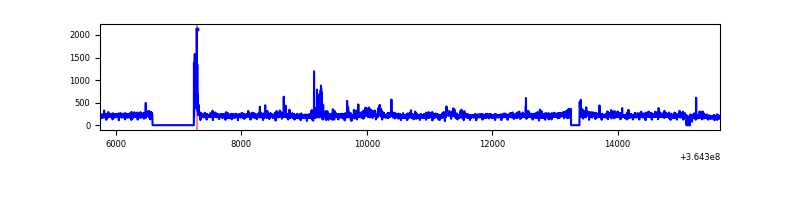 |
| D | 9888 | 9065 | 5 | 5 | 0.05% | 0.06% |  |
Top three noisy pixels from each quadrant. If the there are fewer than three noisy pixels in the level2.evt file, extra rows are filled as -1
| Pixel properties | Quadrant properties | ||||||
|---|---|---|---|---|---|---|---|
| Quadrant | DetID | PixID | Counts | Sigma | Mean | Median | Sigma |
| A | 5 | 16 | 63209 | 583.82 | 484 | 474 | 107.5 |
| A | 13 | 254 | 16471 | 148.87 | 484 | 474 | 107.5 |
| A | 13 | 170 | 6219 | 53.46 | 484 | 474 | 107.5 |
| B | 6 | 159 | 2450011 | 26304.33 | 475 | 463 | 93.1 |
| B | 5 | 172 | 170248 | 1823.23 | 475 | 463 | 93.1 |
| B | 0 | 190 | 164821 | 1764.95 | 475 | 463 | 93.1 |
| C | 3 | 233 | 106509 | 955.54 | 460 | 456 | 111.0 |
| C | 0 | 10 | 71370 | 638.93 | 460 | 456 | 111.0 |
| C | 2 | 114 | 17441 | 153.03 | 460 | 456 | 111.0 |
| D | 8 | 195 | 828587 | 7420.6 | 477 | 460 | 111.6 |
| D | 10 | 203 | 69724 | 620.65 | 477 | 460 | 111.6 |
| D | 2 | 250 | 49158 | 436.37 | 477 | 460 | 111.6 |
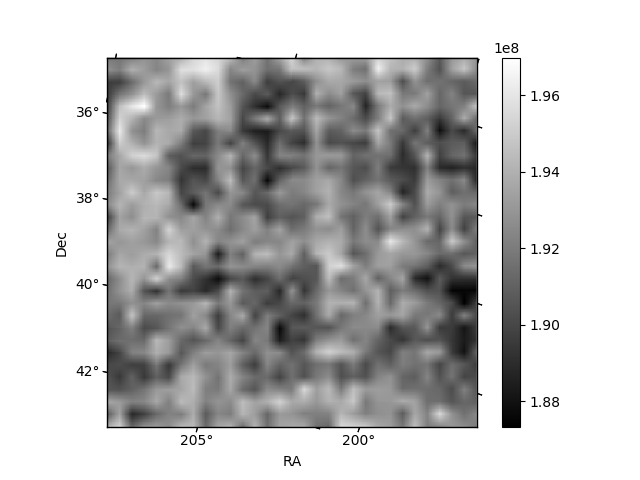
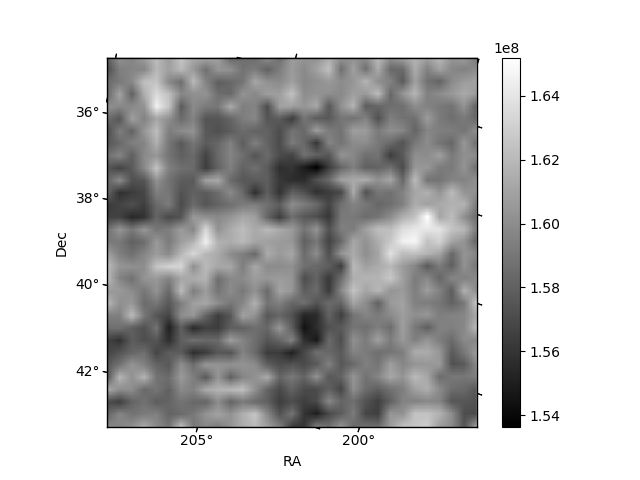
Histogram calculated using DETX and DETY for each event in the final _common_clean file
| Quadrant A |  |
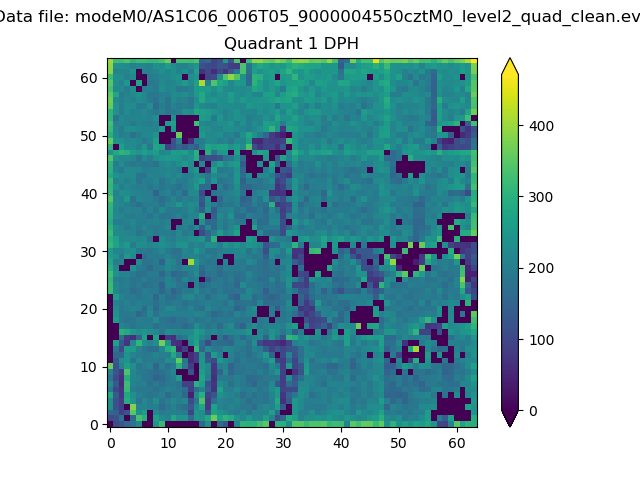 |
Quadrant B |
|---|---|---|---|
| Quadrant D |  |
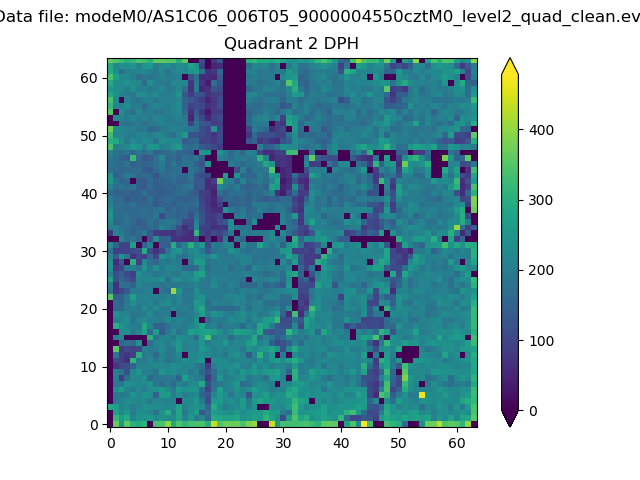 |
Quadrant C |
| Plot type | Count rate plots | Images |
|---|---|---|
| Comparison with Poisson distribution Blue bars denote a histogram of data divided into 1 sec bins. Red curve is a Poisson curve with rate = median count rate of data. |
 |
 |
| Quadrant-wise count rates Data is divided into 100 sec bins |
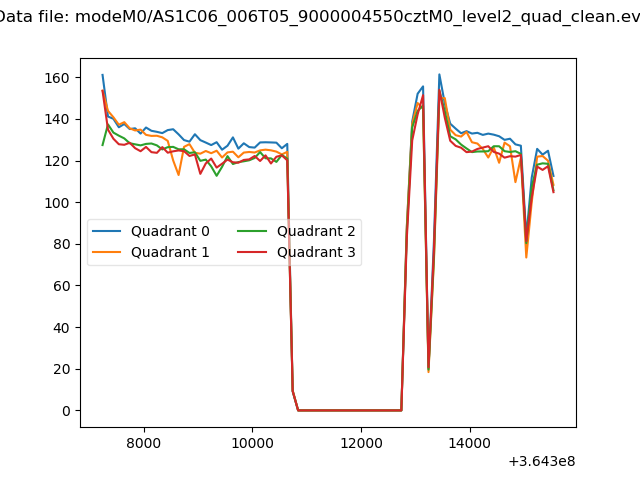 |
|
| Module-wise count rates for Quadrant A Data is divided into 100 sec bins |
 |
 |
| Module-wise count rates for Quadrant B Data is divided into 100 sec bins |
 |
 |
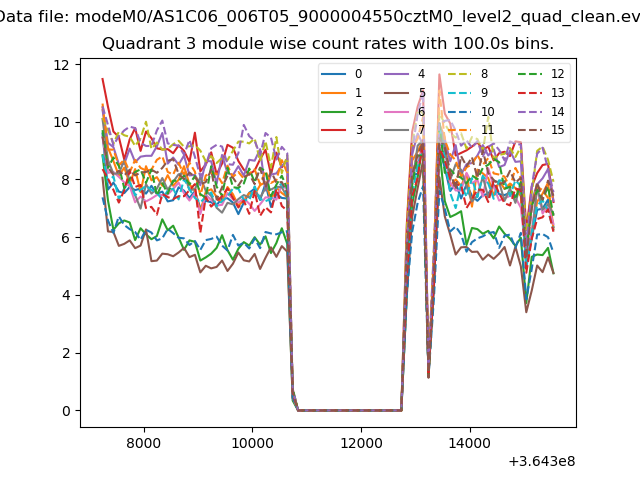
| Module-wise count rates for Quadrant C Data is divided into 100 sec bins |
 |
 |
| Module-wise count rates for Quadrant D Data is divided into 100 sec bins |
 |
 |
| Parameter | Plot |
|---|---|
| CZT HV Monitor |  |
| D_VDD |  |
| Temperature 1 |  |
| Veto HV Monitor |  |
| Veto LLD | 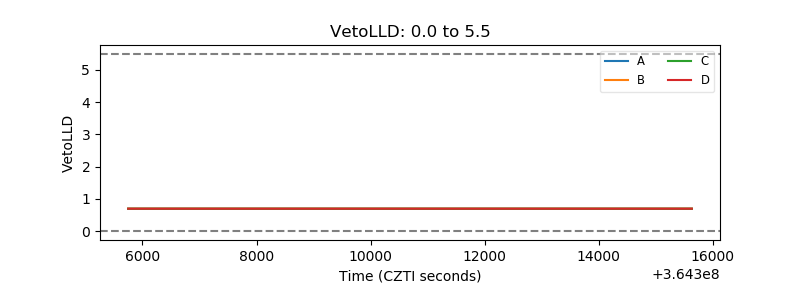 |
| Alpha Counter | 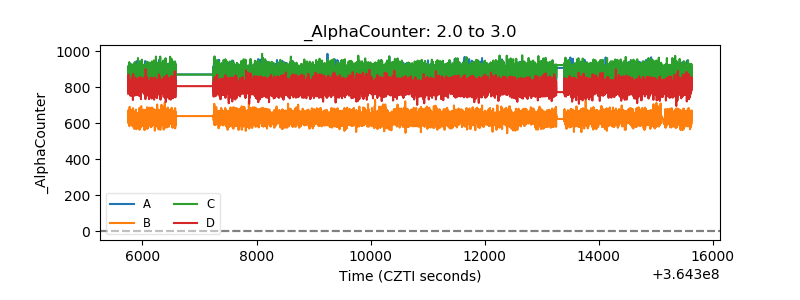 |
| _CPM_Rate | 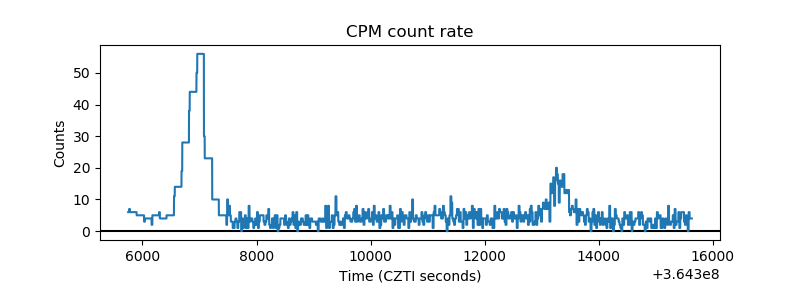 |
| CZT Counter |  |
| +2.5 Volts monitor | 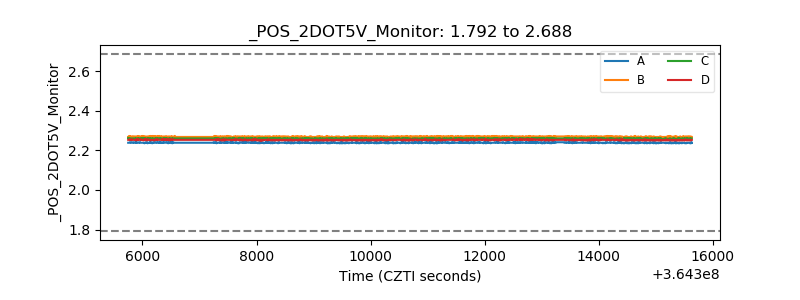 |
| +5 Volts monitor | 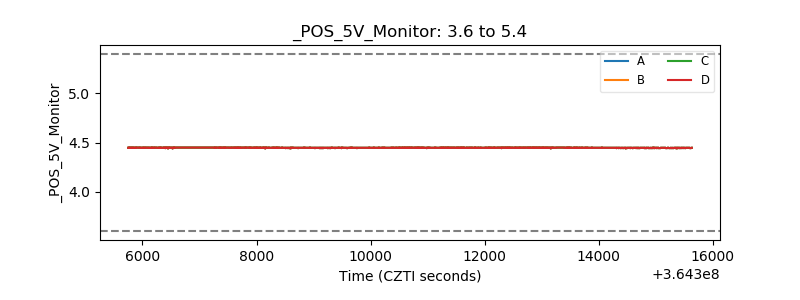 |
| _ROLL_ROT | 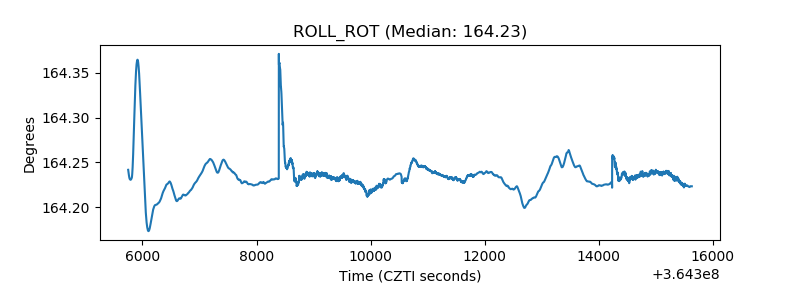 |
| _Roll_DEC |  |
| _Roll_RA |  |
| Veto Counter |  |