| Param | Original file | Final file |
|---|---|---|
| Filename | modeM0/AS1A10_053T42_9000004544cztM0_level2_bc.evt | modeM0/AS1A10_053T42_9000004544cztM0_level2_quad_clean.evt |
| Size (bytes) | 661,907,520 | 190,739,520 |
| Size | 631.2 MB | 181.9 MB |
| Events in quadrant A | 2,972,959 | 1,221,730 |
| Events in quadrant B | 7,362,306 | 1,208,184 |
| Events in quadrant C | 3,444,375 | 1,168,272 |
| Events in quadrant D | 5,254,887 | 1,159,285 |
| Mode M0 | |||
|---|---|---|---|
| Quadrant | BADHDUFLAG | Total packets | Discarded packets |
| A | 0 | 30330 | 0 |
| B | 0 | 45533 | 0 |
| C | 0 | 32689 | 0 |
| D | 0 | 37934 | 0 |
| Mode SS | |||
|---|---|---|---|
| Quadrant | BADHDUFLAG | Total packets | Discarded packets |
| A | 0 | 300 | 0 |
| B | 0 | 300 | 0 |
| C | 0 | 300 | 0 |
| D | 0 | 300 | 0 |
| Mode M9 | |||
|---|---|---|---|
| Quadrant | BADHDUFLAG | Total packets | Discarded packets |
| A | 0 | 15 | 0 |
| B | 0 | 15 | 0 |
| C | 0 | 15 | 0 |
| D | 0 | 15 | 0 |
| Quadrant | Total seconds | Saturated seconds | Saturation percentage |
|---|---|---|---|
| A | 14779 | 132 | 0.893159% |
| B | 14779 | 390 | 2.638879% |
| C | 14779 | 543 | 3.674132% |
| D | 14779 | 512 | 3.464375% |
Noise dominated data is calculated using 1-second bins in cleaned event files. If a bin has >2000 counts, and if more than 50% of those come from <1% of pixels, then it is considered to be noise-dominated and hence unusable.
| Quadrant | # 1 sec bins | Bins with >0 counts | Bins with >2000 counts | High rate bins dominated by noise | Noise dominated (total time) | Noise dominated (detector-on time) | Marked lightcurve |
|---|---|---|---|---|---|---|---|
| A | 16194 | 14779 | 0 | 0 | 0.00% | 0.00% |  |
| B | 16194 | 14779 | 5 | 5 | 0.03% | 0.03% |  |
| C | 16194 | 14779 | 0 | 0 | 0.00% | 0.00% |  |
| D | 16194 | 14779 | 46 | 46 | 0.28% | 0.31% |  |
Top three noisy pixels from each quadrant. If the there are fewer than three noisy pixels in the level2.evt file, extra rows are filled as -1
| Pixel properties | Quadrant properties | ||||||
|---|---|---|---|---|---|---|---|
| Quadrant | DetID | PixID | Counts | Sigma | Mean | Median | Sigma |
| A | 13 | 254 | 26000 | 148.56 | 769 | 753 | 169.9 |
| A | 0 | 226 | 4833 | 24.01 | 769 | 753 | 169.9 |
| A | 12 | 194 | 4730 | 23.4 | 769 | 753 | 169.9 |
| B | 6 | 159 | 4023737 | 26781.62 | 763 | 744 | 150.2 |
| B | 0 | 190 | 202558 | 1343.5 | 763 | 744 | 150.2 |
| B | 4 | 80 | 86524 | 571.05 | 763 | 744 | 150.2 |
| C | 3 | 233 | 347187 | 1998.34 | 725 | 721 | 173.4 |
| C | 0 | 10 | 214343 | 1232.13 | 725 | 721 | 173.4 |
| C | 14 | 254 | 46636 | 264.83 | 725 | 721 | 173.4 |
| D | 8 | 195 | 1480087 | 8585.06 | 745 | 720 | 172.3 |
| D | 12 | 79 | 666770 | 3865.22 | 745 | 720 | 172.3 |
| D | 11 | 176 | 73012 | 419.52 | 745 | 720 | 172.3 |
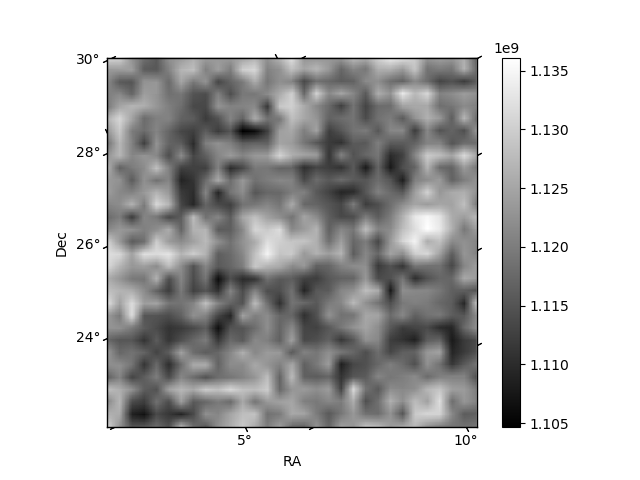
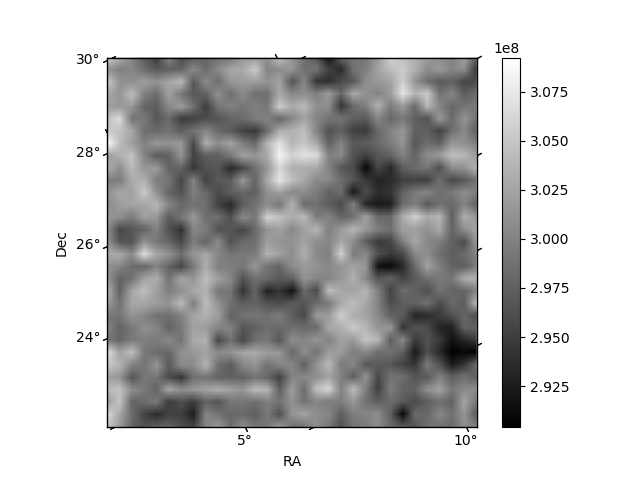
Histogram calculated using DETX and DETY for each event in the final _common_clean file
| Quadrant A |  |
 |
Quadrant B |
|---|---|---|---|
| Quadrant D |  |
 |
Quadrant C |
| Plot type | Count rate plots | Images |
|---|---|---|
| Comparison with Poisson distribution Blue bars denote a histogram of data divided into 1 sec bins. Red curve is a Poisson curve with rate = median count rate of data. |
 |
 |
| Quadrant-wise count rates Data is divided into 100 sec bins |
 |
|
| Module-wise count rates for Quadrant A Data is divided into 100 sec bins |
 |
 |
| Module-wise count rates for Quadrant B Data is divided into 100 sec bins |
 |
 |
| Module-wise count rates for Quadrant C Data is divided into 100 sec bins |
 |
 |
| Module-wise count rates for Quadrant D Data is divided into 100 sec bins |
 |
 |
| Parameter | Plot |
|---|---|
| CZT HV Monitor |  |
| D_VDD |  |
| Temperature 1 |  |
| Veto HV Monitor |  |
| Veto LLD |  |
| Alpha Counter |  |
| _CPM_Rate |  |
| CZT Counter |  |
| +2.5 Volts monitor |  |
| +5 Volts monitor |  |
| _ROLL_ROT |  |
| _Roll_DEC |  |
| _Roll_RA |  |
| Veto Counter |  |