| Param | Original file | Final file |
|---|---|---|
| Filename | modeM0/AS1A10_053T40_9000004542cztM0_level2_bc.evt | modeM0/AS1A10_053T40_9000004542cztM0_level2_quad_clean.evt |
| Size (bytes) | 493,646,400 | 150,969,600 |
| Size | 470.8 MB | 144.0 MB |
| Events in quadrant A | 2,370,928 | 971,419 |
| Events in quadrant B | 5,666,574 | 956,828 |
| Events in quadrant C | 2,703,715 | 918,187 |
| Events in quadrant D | 3,415,582 | 926,861 |
| Mode M0 | |||
|---|---|---|---|
| Quadrant | BADHDUFLAG | Total packets | Discarded packets |
| A | 0 | 24018 | 0 |
| B | 0 | 35444 | 0 |
| C | 0 | 25662 | 0 |
| D | 0 | 26924 | 0 |
| Mode SS | |||
|---|---|---|---|
| Quadrant | BADHDUFLAG | Total packets | Discarded packets |
| A | 0 | 236 | 0 |
| B | 0 | 236 | 0 |
| C | 0 | 236 | 0 |
| D | 0 | 236 | 0 |
| Mode M9 | |||
|---|---|---|---|
| Quadrant | BADHDUFLAG | Total packets | Discarded packets |
| A | 0 | 5 | 0 |
| B | 0 | 5 | 0 |
| C | 0 | 5 | 0 |
| D | 0 | 5 | 0 |
| Quadrant | Total seconds | Saturated seconds | Saturation percentage |
|---|---|---|---|
| A | 11545 | 304 | 2.633175% |
| B | 11545 | 478 | 4.140320% |
| C | 11545 | 634 | 5.491555% |
| D | 11545 | 261 | 2.260719% |
Noise dominated data is calculated using 1-second bins in cleaned event files. If a bin has >2000 counts, and if more than 50% of those come from <1% of pixels, then it is considered to be noise-dominated and hence unusable.
| Quadrant | # 1 sec bins | Bins with >0 counts | Bins with >2000 counts | High rate bins dominated by noise | Noise dominated (total time) | Noise dominated (detector-on time) | Marked lightcurve |
|---|---|---|---|---|---|---|---|
| A | 12055 | 11546 | 0 | 0 | 0.00% | 0.00% |  |
| B | 12055 | 11547 | 3 | 3 | 0.02% | 0.03% |  |
| C | 12055 | 11547 | 2 | 2 | 0.02% | 0.02% |  |
| D | 12055 | 11545 | 2 | 2 | 0.02% | 0.02% | 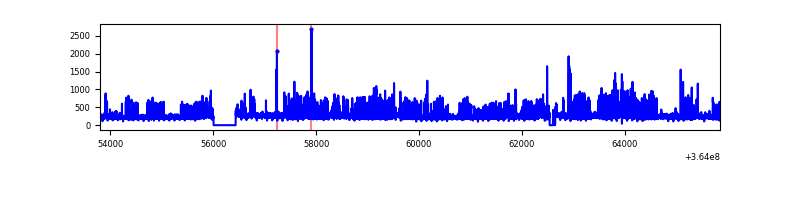 |
Top three noisy pixels from each quadrant. If the there are fewer than three noisy pixels in the level2.evt file, extra rows are filled as -1
| Pixel properties | Quadrant properties | ||||||
|---|---|---|---|---|---|---|---|
| Quadrant | DetID | PixID | Counts | Sigma | Mean | Median | Sigma |
| A | 13 | 254 | 20913 | 149.08 | 612 | 600 | 136.3 |
| A | 0 | 226 | 3808 | 23.54 | 612 | 600 | 136.3 |
| A | 12 | 194 | 3651 | 22.39 | 612 | 600 | 136.3 |
| B | 6 | 159 | 3135354 | 26572.58 | 605 | 590 | 118.0 |
| B | 0 | 190 | 75812 | 637.64 | 605 | 590 | 118.0 |
| B | 5 | 172 | 30391 | 252.62 | 605 | 590 | 118.0 |
| C | 3 | 233 | 250345 | 1829.54 | 574 | 569 | 136.5 |
| C | 0 | 10 | 132095 | 963.39 | 574 | 569 | 136.5 |
| C | 14 | 254 | 40803 | 294.7 | 574 | 569 | 136.5 |
| D | 8 | 195 | 900442 | 6493.17 | 601 | 579 | 138.6 |
| D | 2 | 234 | 51570 | 367.94 | 601 | 579 | 138.6 |
| D | 12 | 79 | 43366 | 308.74 | 601 | 579 | 138.6 |
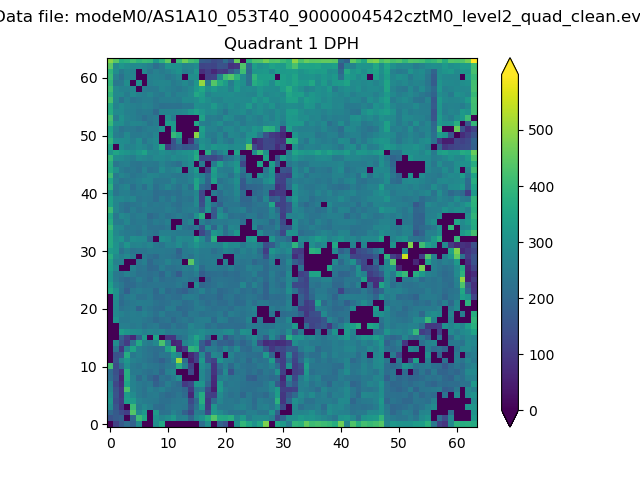
Histogram calculated using DETX and DETY for each event in the final _common_clean file
| Quadrant A |  |
 |
Quadrant B |
|---|---|---|---|
| Quadrant D |  |
 |
Quadrant C |
| Plot type | Count rate plots | Images |
|---|---|---|
| Comparison with Poisson distribution Blue bars denote a histogram of data divided into 1 sec bins. Red curve is a Poisson curve with rate = median count rate of data. |
 |
 |
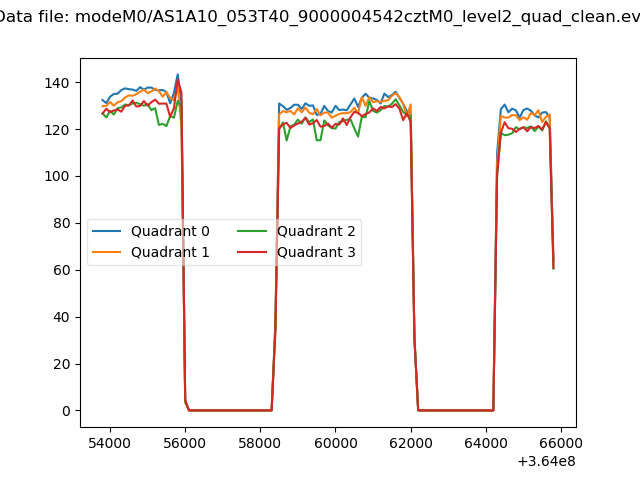
| Quadrant-wise count rates Data is divided into 100 sec bins |
 |
|
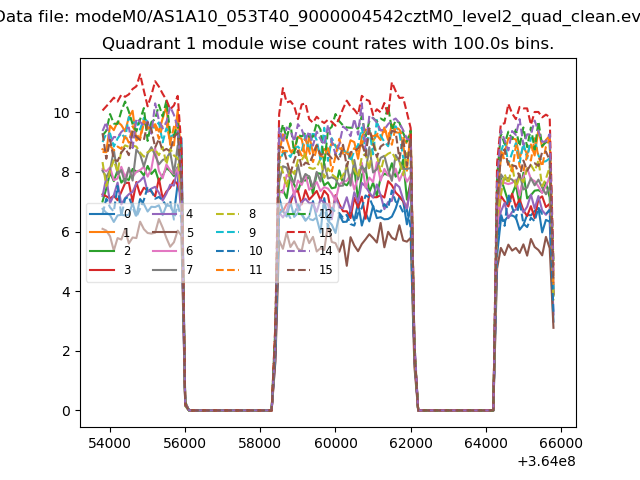
| Module-wise count rates for Quadrant A Data is divided into 100 sec bins |
 |
 |
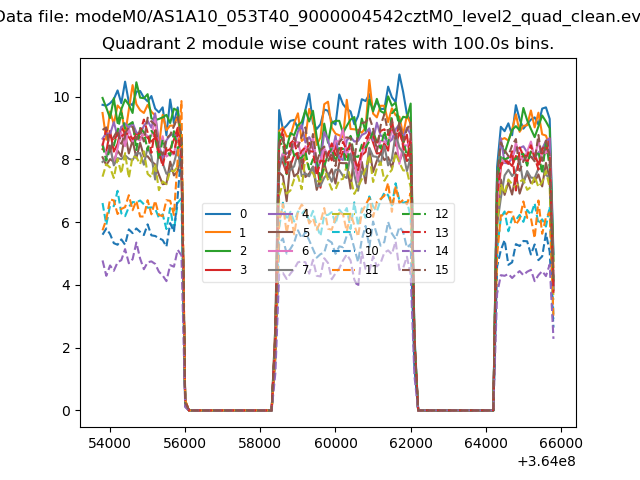
| Module-wise count rates for Quadrant B Data is divided into 100 sec bins |
 |
 |
| Module-wise count rates for Quadrant C Data is divided into 100 sec bins |
 |
 |
| Module-wise count rates for Quadrant D Data is divided into 100 sec bins |
 |
 |
| Parameter | Plot |
|---|---|
| CZT HV Monitor |  |
| D_VDD | 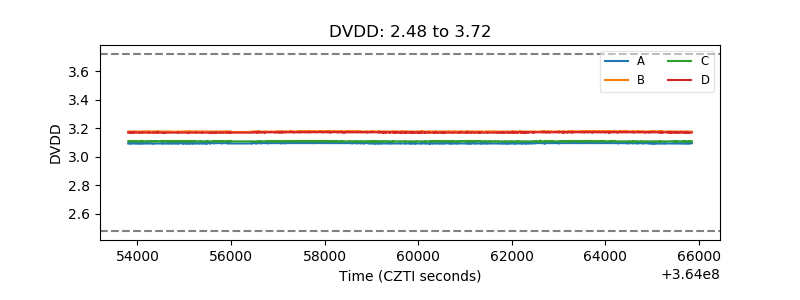 |
| Temperature 1 | 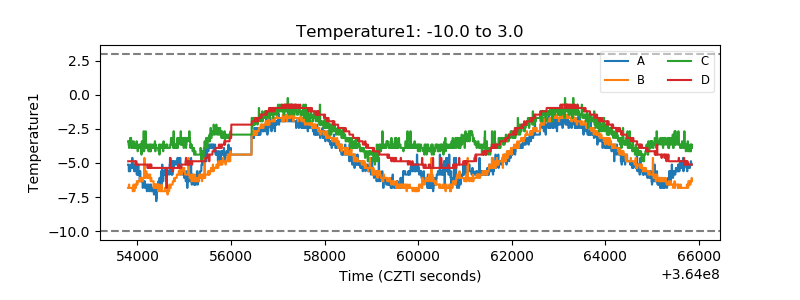 |
| Veto HV Monitor |  |
| Veto LLD |  |
| Alpha Counter | 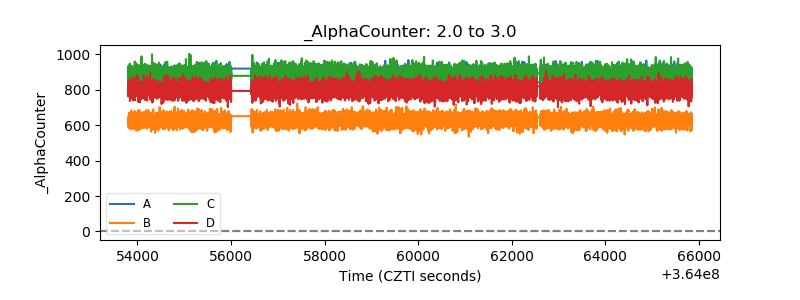 |
| _CPM_Rate |  |
| CZT Counter | 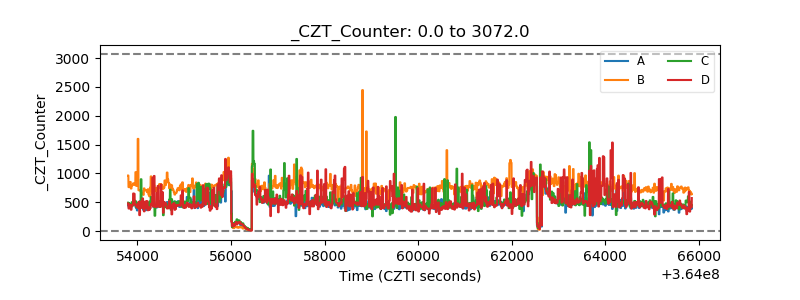 |
| +2.5 Volts monitor |  |
| +5 Volts monitor |  |
| _ROLL_ROT |  |
| _Roll_DEC |  |
| _Roll_RA |  |
| Veto Counter |  |