| Param | Original file | Final file |
|---|---|---|
| Filename | modeM0/AS1A10_053T31_9000004540cztM0_level2_bc.evt | modeM0/AS1A10_053T31_9000004540cztM0_level2_quad_clean.evt |
| Size (bytes) | 596,975,040 | 132,027,840 |
| Size | 569.3 MB | 125.9 MB |
| Events in quadrant A | 2,657,887 | 821,909 |
| Events in quadrant B | 6,094,930 | 807,212 |
| Events in quadrant C | 3,377,494 | 765,720 |
| Events in quadrant D | 5,129,127 | 775,799 |
| Mode M9 | |||
|---|---|---|---|
| Quadrant | BADHDUFLAG | Total packets | Discarded packets |
| A | 0 | 21 | 0 |
| B | 0 | 21 | 0 |
| C | 0 | 21 | 0 |
| D | 0 | 21 | 0 |
| Mode SS | |||
|---|---|---|---|
| Quadrant | BADHDUFLAG | Total packets | Discarded packets |
| A | 0 | 242 | 0 |
| B | 0 | 242 | 0 |
| C | 0 | 242 | 0 |
| D | 0 | 242 | 0 |
| Mode M0 | |||
|---|---|---|---|
| Quadrant | BADHDUFLAG | Total packets | Discarded packets |
| A | 0 | 24866 | 0 |
| B | 0 | 37102 | 0 |
| C | 0 | 29115 | 0 |
| D | 0 | 34283 | 0 |
| Quadrant | Total seconds | Saturated seconds | Saturation percentage |
|---|---|---|---|
| A | 11967 | 213 | 1.779895% |
| B | 11967 | 387 | 3.233893% |
| C | 11967 | 599 | 5.005432% |
| D | 11967 | 752 | 6.283948% |
Noise dominated data is calculated using 1-second bins in cleaned event files. If a bin has >2000 counts, and if more than 50% of those come from <1% of pixels, then it is considered to be noise-dominated and hence unusable.
| Quadrant | # 1 sec bins | Bins with >0 counts | Bins with >2000 counts | High rate bins dominated by noise | Noise dominated (total time) | Noise dominated (detector-on time) | Marked lightcurve |
|---|---|---|---|---|---|---|---|
| A | 14002 | 11967 | 0 | 0 | 0.00% | 0.00% |  |
| B | 14002 | 11967 | 0 | 0 | 0.00% | 0.00% | 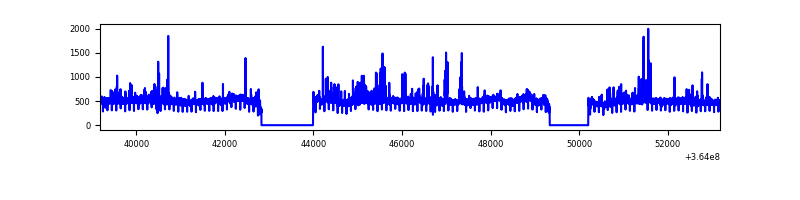 |
| C | 14002 | 11969 | 2 | 2 | 0.01% | 0.02% | 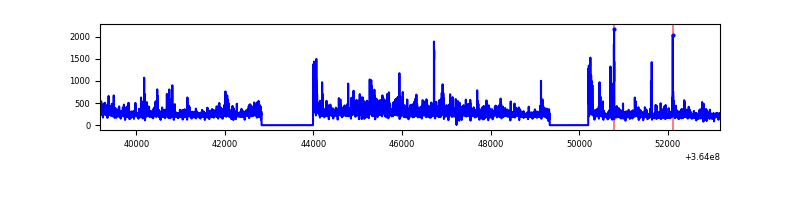 |
| D | 14002 | 11965 | 64 | 64 | 0.46% | 0.53% | 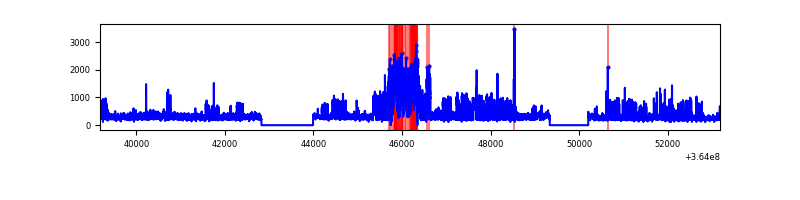 |
Top three noisy pixels from each quadrant. If the there are fewer than three noisy pixels in the level2.evt file, extra rows are filled as -1
| Pixel properties | Quadrant properties | ||||||
|---|---|---|---|---|---|---|---|
| Quadrant | DetID | PixID | Counts | Sigma | Mean | Median | Sigma |
| A | 13 | 254 | 21796 | 141.91 | 686 | 675 | 148.8 |
| A | 5 | 16 | 5679 | 33.62 | 686 | 675 | 148.8 |
| A | 0 | 226 | 4475 | 25.53 | 686 | 675 | 148.8 |
| B | 6 | 159 | 3149875 | 24413.74 | 676 | 661 | 129.0 |
| B | 0 | 190 | 169034 | 1305.28 | 676 | 661 | 129.0 |
| B | 4 | 80 | 51793 | 396.39 | 676 | 661 | 129.0 |
| C | 3 | 233 | 572810 | 3741.09 | 642 | 640 | 152.9 |
| C | 0 | 10 | 198318 | 1292.5 | 642 | 640 | 152.9 |
| C | 14 | 254 | 58248 | 376.67 | 642 | 640 | 152.9 |
| D | 8 | 195 | 1683011 | 11169.88 | 660 | 641 | 150.6 |
| D | 12 | 233 | 822507 | 5456.67 | 660 | 641 | 150.6 |
| D | 2 | 234 | 49543 | 324.68 | 660 | 641 | 150.6 |
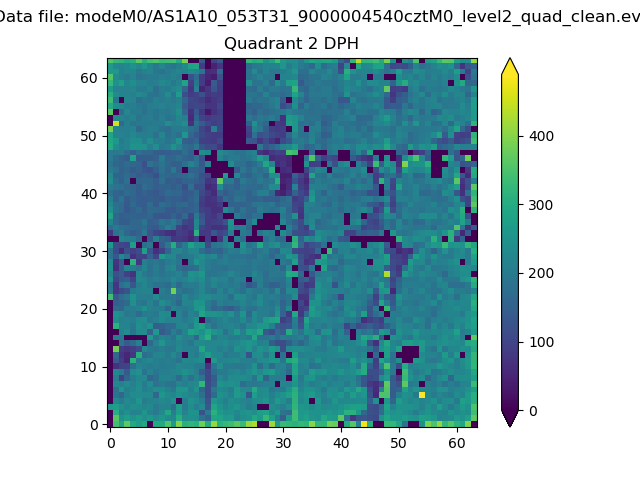
Histogram calculated using DETX and DETY for each event in the final _common_clean file
| Quadrant A |  |
 |
Quadrant B |
|---|---|---|---|
| Quadrant D |  |
 |
Quadrant C |
| Plot type | Count rate plots | Images |
|---|---|---|
| Comparison with Poisson distribution Blue bars denote a histogram of data divided into 1 sec bins. Red curve is a Poisson curve with rate = median count rate of data. |
 |
 |
| Quadrant-wise count rates Data is divided into 100 sec bins |
 |
|
| Module-wise count rates for Quadrant A Data is divided into 100 sec bins |
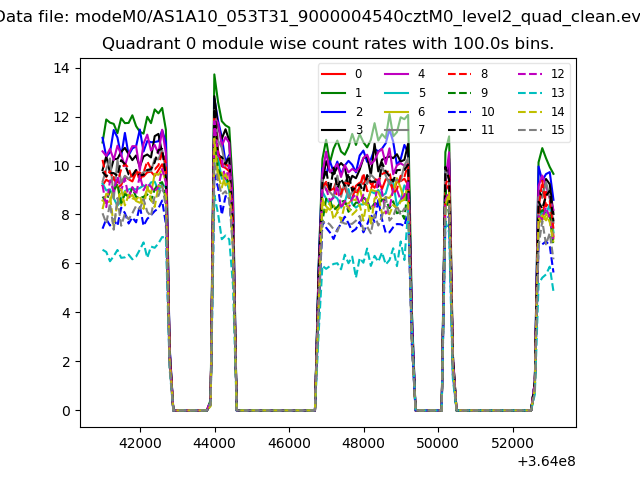 |
 |
| Module-wise count rates for Quadrant B Data is divided into 100 sec bins |
 |
 |
| Module-wise count rates for Quadrant C Data is divided into 100 sec bins |
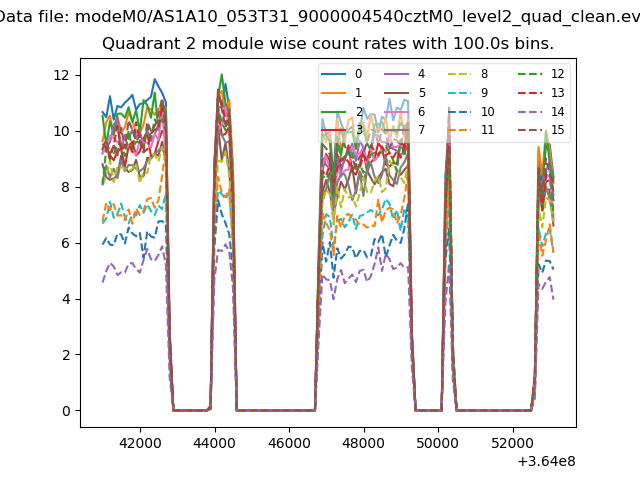 |
 |
| Module-wise count rates for Quadrant D Data is divided into 100 sec bins |
 |
 |
| Parameter | Plot |
|---|---|
| CZT HV Monitor | 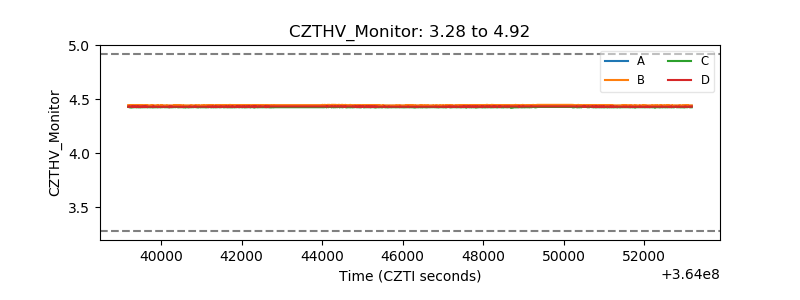 |
| D_VDD |  |
| Temperature 1 | 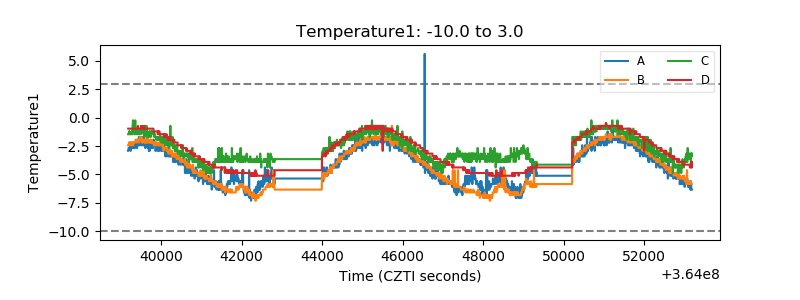 |
| Veto HV Monitor | 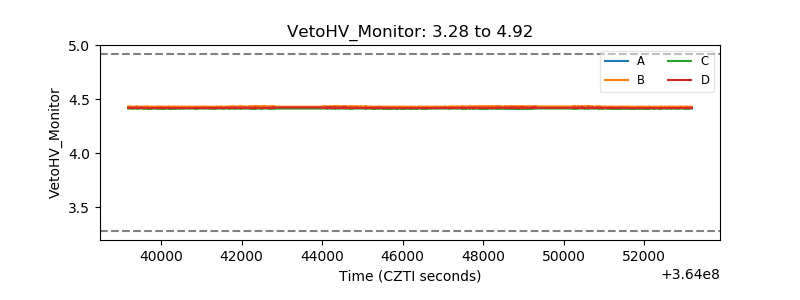 |
| Veto LLD |  |
| Alpha Counter |  |
| _CPM_Rate |  |
| CZT Counter | 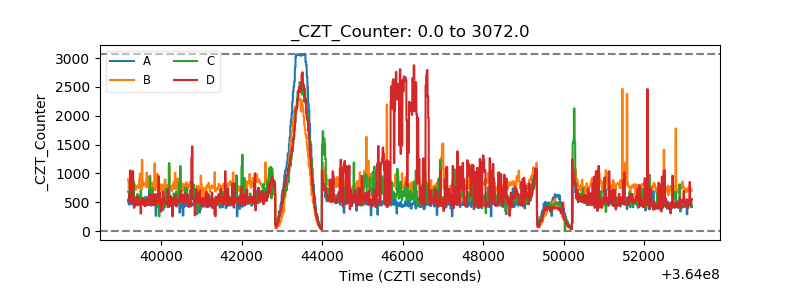 |
| +2.5 Volts monitor |  |
| +5 Volts monitor |  |
| _ROLL_ROT |  |
| _Roll_DEC |  |
| _Roll_RA |  |
| Veto Counter | 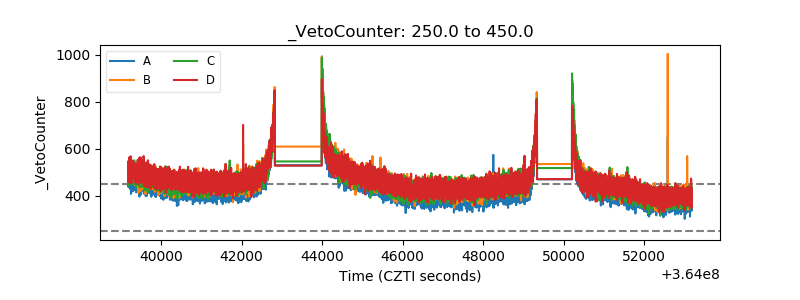 |