| Param | Original file | Final file |
|---|---|---|
| Filename | modeM0/AS1A10_053T30_9000004536cztM0_level2_bc.evt | modeM0/AS1A10_053T30_9000004536cztM0_level2_quad_clean.evt |
| Size (bytes) | 1,855,779,840 | 508,354,560 |
| Size | 1.7 GB | 484.8 MB |
| Events in quadrant A | 8,719,362 | 3,256,246 |
| Events in quadrant B | 21,928,795 | 3,208,746 |
| Events in quadrant C | 10,771,236 | 3,104,173 |
| Events in quadrant D | 12,082,596 | 3,103,910 |
| Mode M0 | |||
|---|---|---|---|
| Quadrant | BADHDUFLAG | Total packets | Discarded packets |
| A | 0 | 82863 | 0 |
| B | 0 | 131302 | 0 |
| C | 0 | 94796 | 0 |
| D | 0 | 92558 | 0 |
| Mode SS | |||
|---|---|---|---|
| Quadrant | BADHDUFLAG | Total packets | Discarded packets |
| A | 0 | 808 | 0 |
| B | 0 | 808 | 0 |
| C | 0 | 808 | 0 |
| D | 0 | 808 | 0 |
| Mode M9 | |||
|---|---|---|---|
| Quadrant | BADHDUFLAG | Total packets | Discarded packets |
| A | 0 | 68 | 0 |
| B | 0 | 68 | 0 |
| C | 0 | 68 | 0 |
| D | 0 | 68 | 0 |
| Quadrant | Total seconds | Saturated seconds | Saturation percentage |
|---|---|---|---|
| A | 39678 | 185 | 0.466253% |
| B | 39678 | 1680 | 4.234084% |
| C | 39678 | 1162 | 2.928575% |
| D | 39678 | 236 | 0.594788% |
Noise dominated data is calculated using 1-second bins in cleaned event files. If a bin has >2000 counts, and if more than 50% of those come from <1% of pixels, then it is considered to be noise-dominated and hence unusable.
| Quadrant | # 1 sec bins | Bins with >0 counts | Bins with >2000 counts | High rate bins dominated by noise | Noise dominated (total time) | Noise dominated (detector-on time) | Marked lightcurve |
|---|---|---|---|---|---|---|---|
| A | 46473 | 39679 | 1 | 1 | 0.00% | 0.00% | 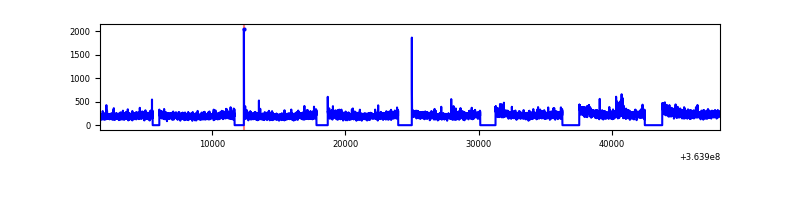 |
| B | 46473 | 39678 | 17 | 17 | 0.04% | 0.04% |  |
| C | 46473 | 39678 | 3 | 3 | 0.01% | 0.01% |  |
| D | 46473 | 39677 | 15 | 15 | 0.03% | 0.04% |  |
Top three noisy pixels from each quadrant. If the there are fewer than three noisy pixels in the level2.evt file, extra rows are filled as -1
| Pixel properties | Quadrant properties | ||||||
|---|---|---|---|---|---|---|---|
| Quadrant | DetID | PixID | Counts | Sigma | Mean | Median | Sigma |
| A | 13 | 254 | 69894 | 142.1 | 2236 | 2203 | 476.4 |
| A | 5 | 16 | 56763 | 114.53 | 2236 | 2203 | 476.4 |
| A | 8 | 192 | 30797 | 60.03 | 2236 | 2203 | 476.4 |
| B | 6 | 159 | 10446959 | 25506.76 | 2192 | 2143 | 409.5 |
| B | 4 | 80 | 2002911 | 4885.98 | 2192 | 2143 | 409.5 |
| B | 0 | 190 | 430056 | 1044.98 | 2192 | 2143 | 409.5 |
| C | 3 | 233 | 2212265 | 4473.45 | 2112 | 2112 | 494.1 |
| C | 0 | 10 | 191834 | 384.01 | 2112 | 2112 | 494.1 |
| C | 14 | 254 | 78137 | 153.88 | 2112 | 2112 | 494.1 |
| D | 8 | 195 | 2800647 | 5631.68 | 2200 | 2135 | 496.9 |
| D | 12 | 79 | 411242 | 823.28 | 2200 | 2135 | 496.9 |
| D | 2 | 250 | 225760 | 450.02 | 2200 | 2135 | 496.9 |
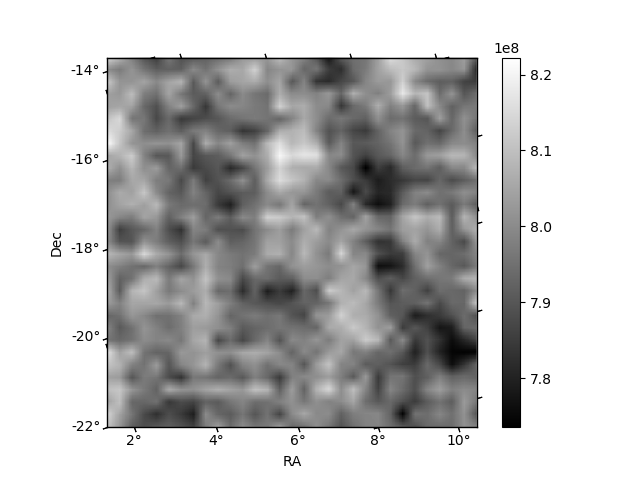
Histogram calculated using DETX and DETY for each event in the final _common_clean file
| Quadrant A |  |
 |
Quadrant B |
|---|---|---|---|
| Quadrant D |  |
 |
Quadrant C |
| Plot type | Count rate plots | Images |
|---|---|---|
| Comparison with Poisson distribution Blue bars denote a histogram of data divided into 1 sec bins. Red curve is a Poisson curve with rate = median count rate of data. |
 |
 |
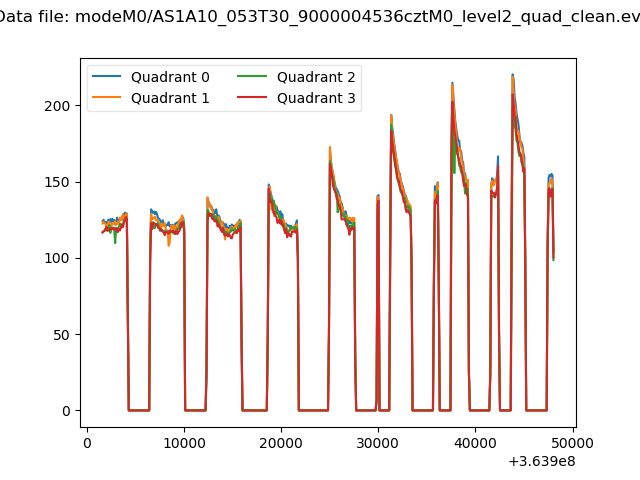
| Quadrant-wise count rates Data is divided into 100 sec bins |
 |
|
| Module-wise count rates for Quadrant A Data is divided into 100 sec bins |
 |
 |
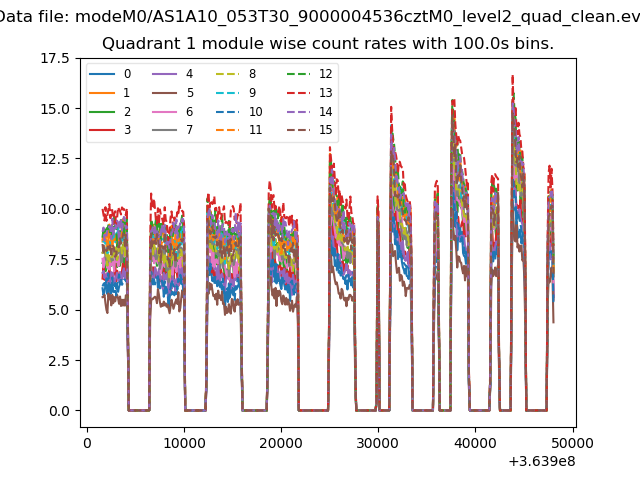
| Module-wise count rates for Quadrant B Data is divided into 100 sec bins |
 |
 |
| Module-wise count rates for Quadrant C Data is divided into 100 sec bins |
 |
 |
| Module-wise count rates for Quadrant D Data is divided into 100 sec bins |
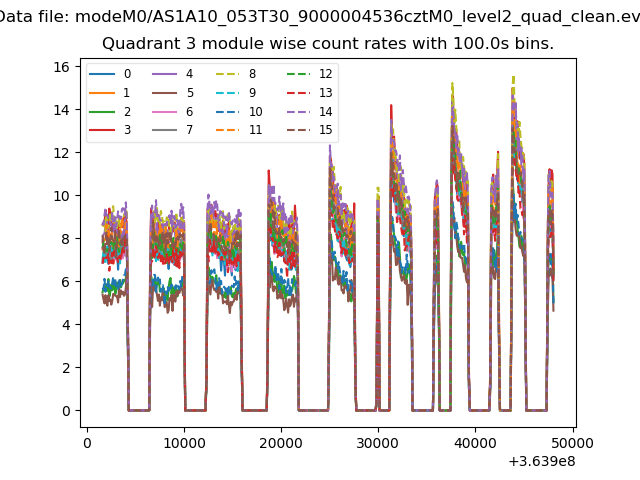 |
 |
| Parameter | Plot |
|---|---|
| CZT HV Monitor |  |
| D_VDD |  |
| Temperature 1 |  |
| Veto HV Monitor | 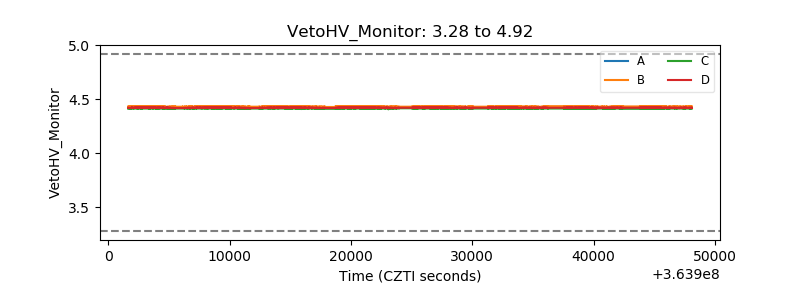 |
| Veto LLD |  |
| Alpha Counter | 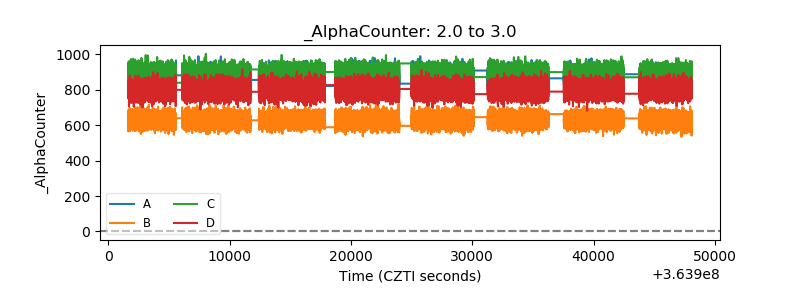 |
| _CPM_Rate |  |
| CZT Counter |  |
| +2.5 Volts monitor |  |
| +5 Volts monitor |  |
| _ROLL_ROT |  |
| _Roll_DEC | 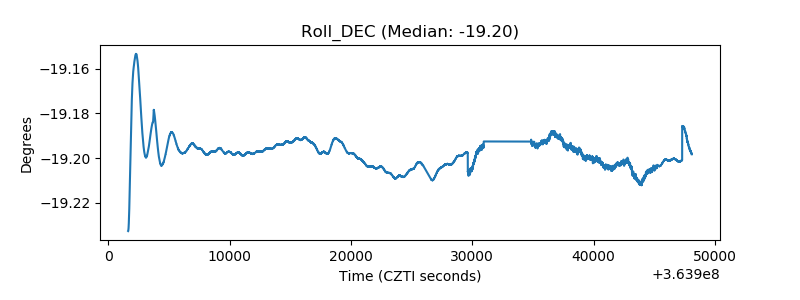 |
| _Roll_RA |  |
| Veto Counter |  |