| Param | Original file | Final file |
|---|---|---|
| Filename | modeM0/AS1A10_053T27_9000004534cztM0_level2_bc.evt | modeM0/AS1A10_053T27_9000004534cztM0_level2_quad_clean.evt |
| Size (bytes) | 972,927,360 | 242,913,600 |
| Size | 927.9 MB | 231.7 MB |
| Events in quadrant A | 4,128,874 | 1,547,977 |
| Events in quadrant B | 10,409,448 | 1,523,844 |
| Events in quadrant C | 7,189,007 | 1,438,906 |
| Events in quadrant D | 6,374,766 | 1,472,062 |
| Mode SS | |||
|---|---|---|---|
| Quadrant | BADHDUFLAG | Total packets | Discarded packets |
| A | 0 | 406 | 0 |
| B | 0 | 406 | 0 |
| C | 0 | 406 | 0 |
| D | 0 | 406 | 0 |
| Mode M9 | |||
|---|---|---|---|
| Quadrant | BADHDUFLAG | Total packets | Discarded packets |
| A | 0 | 18 | 0 |
| B | 0 | 18 | 0 |
| C | 0 | 18 | 0 |
| D | 0 | 18 | 0 |
| Mode M0 | |||
|---|---|---|---|
| Quadrant | BADHDUFLAG | Total packets | Discarded packets |
| A | 0 | 41687 | 0 |
| B | 0 | 64030 | 0 |
| C | 0 | 57408 | 0 |
| D | 0 | 48142 | 0 |
| Quadrant | Total seconds | Saturated seconds | Saturation percentage |
|---|---|---|---|
| A | 19953 | 433 | 2.170100% |
| B | 19953 | 1208 | 6.054227% |
| C | 19953 | 2038 | 10.214003% |
| D | 19953 | 455 | 2.280359% |
Noise dominated data is calculated using 1-second bins in cleaned event files. If a bin has >2000 counts, and if more than 50% of those come from <1% of pixels, then it is considered to be noise-dominated and hence unusable.
| Quadrant | # 1 sec bins | Bins with >0 counts | Bins with >2000 counts | High rate bins dominated by noise | Noise dominated (total time) | Noise dominated (detector-on time) | Marked lightcurve |
|---|---|---|---|---|---|---|---|
| A | 21693 | 19954 | 0 | 0 | 0.00% | 0.00% |  |
| B | 21693 | 19952 | 8 | 8 | 0.04% | 0.04% |  |
| C | 21693 | 19950 | 11 | 11 | 0.05% | 0.06% |  |
| D | 21693 | 19954 | 12 | 12 | 0.06% | 0.06% |  |
Top three noisy pixels from each quadrant. If the there are fewer than three noisy pixels in the level2.evt file, extra rows are filled as -1
| Pixel properties | Quadrant properties | ||||||
|---|---|---|---|---|---|---|---|
| Quadrant | DetID | PixID | Counts | Sigma | Mean | Median | Sigma |
| A | 13 | 254 | 35544 | 148.48 | 1067 | 1047 | 232.3 |
| A | 0 | 226 | 6732 | 24.47 | 1067 | 1047 | 232.3 |
| A | 12 | 194 | 6518 | 23.55 | 1067 | 1047 | 232.3 |
| B | 6 | 159 | 5376276 | 26402.62 | 1045 | 1018 | 203.6 |
| B | 4 | 80 | 416239 | 2039.52 | 1045 | 1018 | 203.6 |
| B | 5 | 172 | 281772 | 1379.03 | 1045 | 1018 | 203.6 |
| C | 3 | 233 | 3081810 | 13163.14 | 983 | 976 | 234.1 |
| C | 0 | 10 | 135411 | 574.39 | 983 | 976 | 234.1 |
| C | 14 | 254 | 112532 | 476.63 | 983 | 976 | 234.1 |
| D | 8 | 195 | 2049381 | 8448.8 | 1052 | 1015 | 242.4 |
| D | 12 | 233 | 115354 | 471.61 | 1052 | 1015 | 242.4 |
| D | 2 | 234 | 92329 | 376.64 | 1052 | 1015 | 242.4 |
Histogram calculated using DETX and DETY for each event in the final _common_clean file
| Quadrant A |  |
 |
Quadrant B |
|---|---|---|---|
| Quadrant D |  |
 |
Quadrant C |
| Plot type | Count rate plots | Images |
|---|---|---|
| Comparison with Poisson distribution Blue bars denote a histogram of data divided into 1 sec bins. Red curve is a Poisson curve with rate = median count rate of data. |
 |
 |
| Quadrant-wise count rates Data is divided into 100 sec bins |
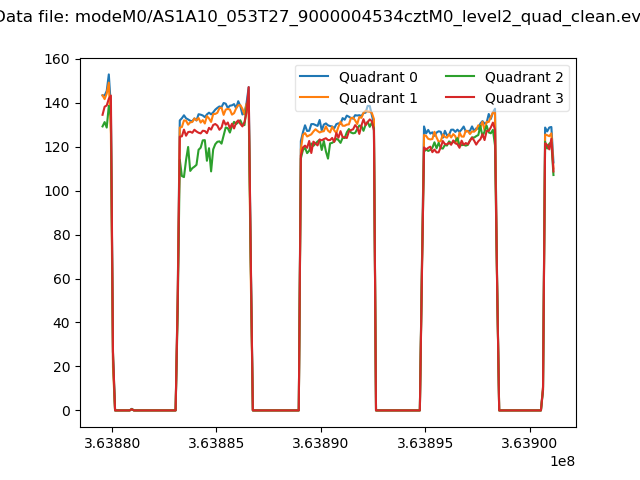 |
|
| Module-wise count rates for Quadrant A Data is divided into 100 sec bins |
 |
 |
| Module-wise count rates for Quadrant B Data is divided into 100 sec bins |
 |
 |
| Module-wise count rates for Quadrant C Data is divided into 100 sec bins |
 |
 |
| Module-wise count rates for Quadrant D Data is divided into 100 sec bins |
 |
 |
| Parameter | Plot |
|---|---|
| CZT HV Monitor | 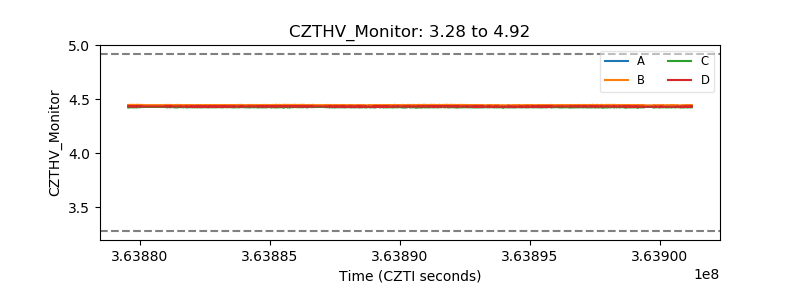 |
| D_VDD | 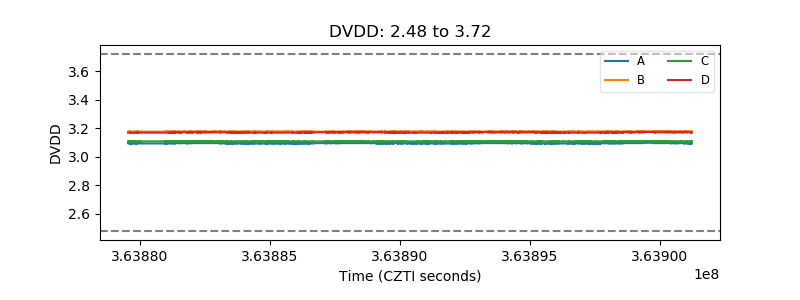 |
| Temperature 1 |  |
| Veto HV Monitor | 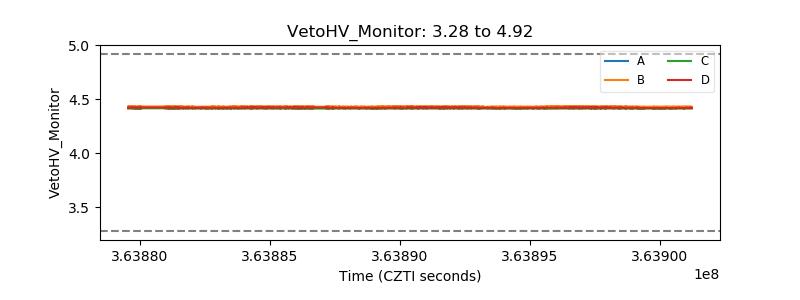 |
| Veto LLD |  |
| Alpha Counter |  |
| _CPM_Rate |  |
| CZT Counter |  |
| +2.5 Volts monitor | 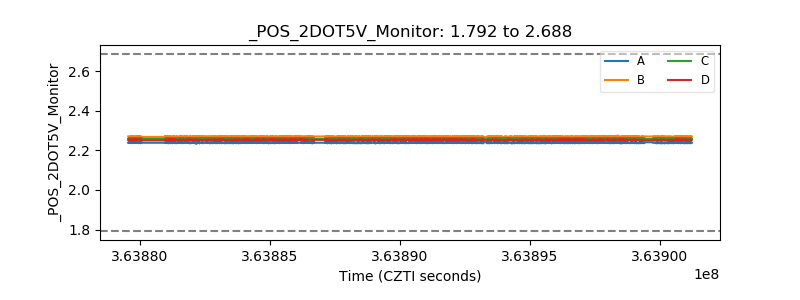 |
| +5 Volts monitor |  |
| _ROLL_ROT | 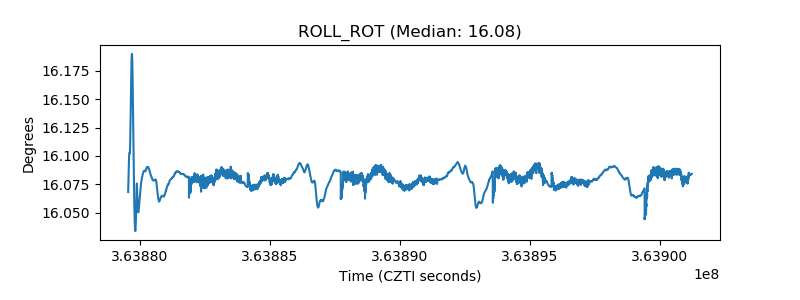 |
| _Roll_DEC | 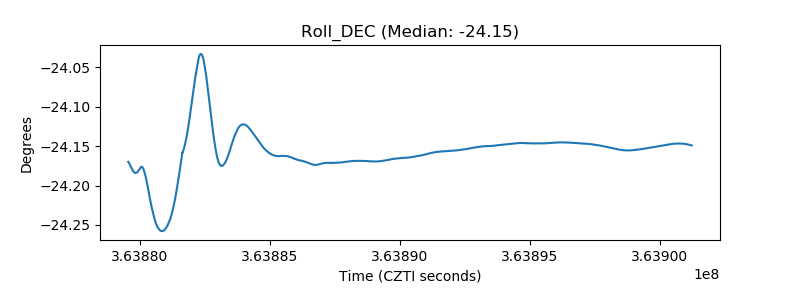 |
| _Roll_RA |  |
| Veto Counter |  |