| Param | Original file | Final file |
|---|---|---|
| Filename | modeM0/AS1A10_058T08_9000004532cztM0_level2_bc.evt | modeM0/AS1A10_058T08_9000004532cztM0_level2_quad_clean.evt |
| Size (bytes) | 3,692,013,120 | 987,762,240 |
| Size | 3.4 GB | 942.0 MB |
| Events in quadrant A | 16,836,298 | 6,402,515 |
| Events in quadrant B | 38,713,354 | 6,293,125 |
| Events in quadrant C | 27,803,741 | 5,912,622 |
| Events in quadrant D | 23,248,406 | 6,052,347 |
| Mode M0 | |||
|---|---|---|---|
| Quadrant | BADHDUFLAG | Total packets | Discarded packets |
| A | 0 | 160550 | 0 |
| B | 0 | 237870 | 0 |
| C | 0 | 222291 | 0 |
| D | 0 | 180097 | 0 |
| Mode M9 | |||
|---|---|---|---|
| Quadrant | BADHDUFLAG | Total packets | Discarded packets |
| A | 0 | 123 | 0 |
| B | 0 | 123 | 0 |
| C | 0 | 123 | 0 |
| D | 0 | 123 | 0 |
| Mode SS | |||
|---|---|---|---|
| Quadrant | BADHDUFLAG | Total packets | Discarded packets |
| A | 0 | 1562 | 0 |
| B | 0 | 1562 | 0 |
| C | 0 | 1562 | 0 |
| D | 0 | 1562 | 0 |
| Quadrant | Total seconds | Saturated seconds | Saturation percentage |
|---|---|---|---|
| A | 76676 | 842 | 1.098127% |
| B | 76676 | 2288 | 2.983985% |
| C | 76676 | 5506 | 7.180865% |
| D | 76676 | 1388 | 1.810214% |
Noise dominated data is calculated using 1-second bins in cleaned event files. If a bin has >2000 counts, and if more than 50% of those come from <1% of pixels, then it is considered to be noise-dominated and hence unusable.
| Quadrant | # 1 sec bins | Bins with >0 counts | Bins with >2000 counts | High rate bins dominated by noise | Noise dominated (total time) | Noise dominated (detector-on time) | Marked lightcurve |
|---|---|---|---|---|---|---|---|
| A | 88972 | 76681 | 0 | 0 | 0.00% | 0.00% |  |
| B | 88972 | 76679 | 13 | 13 | 0.01% | 0.02% |  |
| C | 88972 | 76676 | 15 | 15 | 0.02% | 0.02% |  |
| D | 88972 | 76673 | 191 | 191 | 0.21% | 0.25% | 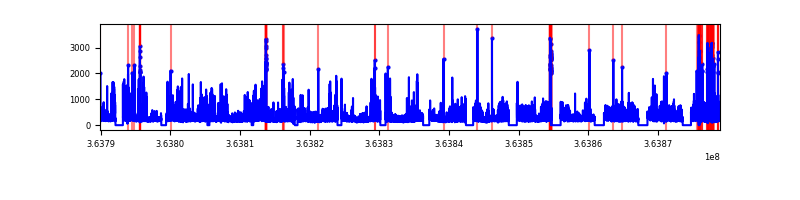 |
Top three noisy pixels from each quadrant. If the there are fewer than three noisy pixels in the level2.evt file, extra rows are filled as -1
| Pixel properties | Quadrant properties | ||||||
|---|---|---|---|---|---|---|---|
| Quadrant | DetID | PixID | Counts | Sigma | Mean | Median | Sigma |
| A | 13 | 254 | 134218 | 140.23 | 4359 | 4292 | 926.5 |
| A | 0 | 226 | 27363 | 24.9 | 4359 | 4292 | 926.5 |
| A | 12 | 194 | 25717 | 23.12 | 4359 | 4292 | 926.5 |
| B | 6 | 159 | 20266719 | 25113.61 | 4303 | 4205 | 806.8 |
| B | 4 | 80 | 1379453 | 1704.5 | 4303 | 4205 | 806.8 |
| B | 0 | 230 | 177125 | 214.32 | 4303 | 4205 | 806.8 |
| C | 3 | 233 | 11459246 | 12222.62 | 4007 | 3996 | 937.2 |
| C | 0 | 10 | 555402 | 588.34 | 4007 | 3996 | 937.2 |
| C | 14 | 254 | 188613 | 196.98 | 4007 | 3996 | 937.2 |
| D | 8 | 195 | 4826918 | 4596.4 | 4192 | 4094 | 1049.3 |
| D | 1 | 52 | 1017261 | 965.6 | 4192 | 4094 | 1049.3 |
| D | 2 | 250 | 453396 | 428.21 | 4192 | 4094 | 1049.3 |
Histogram calculated using DETX and DETY for each event in the final _common_clean file
| Quadrant A |  |
 |
Quadrant B |
|---|---|---|---|
| Quadrant D |  |
 |
Quadrant C |
| Plot type | Count rate plots | Images |
|---|---|---|
| Comparison with Poisson distribution Blue bars denote a histogram of data divided into 1 sec bins. Red curve is a Poisson curve with rate = median count rate of data. |
 |
 |
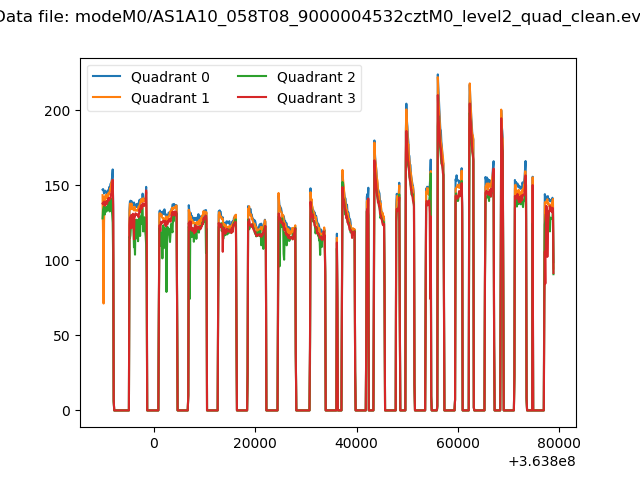
| Quadrant-wise count rates Data is divided into 100 sec bins |
 |
|
| Module-wise count rates for Quadrant A Data is divided into 100 sec bins |
 |
 |
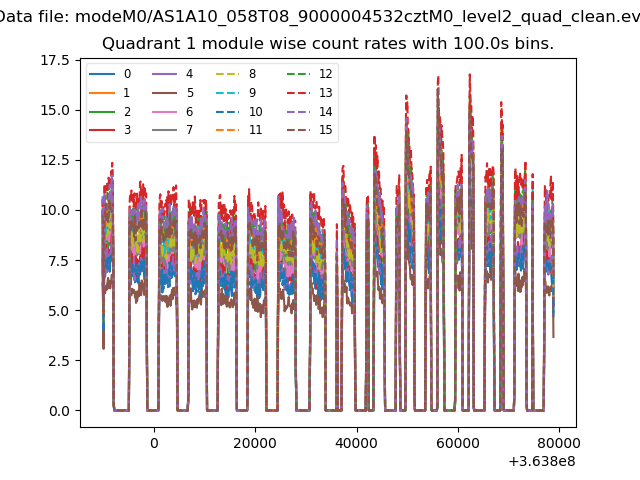
| Module-wise count rates for Quadrant B Data is divided into 100 sec bins |
 |
 |
| Module-wise count rates for Quadrant C Data is divided into 100 sec bins |
 |
 |
| Module-wise count rates for Quadrant D Data is divided into 100 sec bins |
 |
 |
| Parameter | Plot |
|---|---|
| CZT HV Monitor |  |
| D_VDD |  |
| Temperature 1 |  |
| Veto HV Monitor |  |
| Veto LLD |  |
| Alpha Counter |  |
| _CPM_Rate |  |
| CZT Counter |  |
| +2.5 Volts monitor |  |
| +5 Volts monitor |  |
| _ROLL_ROT |  |
| _Roll_DEC |  |
| _Roll_RA |  |
| Veto Counter |  |