| Param | Original file | Final file |
|---|---|---|
| Filename | modeM0/AS1T04_024T01_9000004530cztM0_level2_bc.evt | modeM0/AS1T04_024T01_9000004530cztM0_level2_quad_clean.evt |
| Size (bytes) | 4,841,657,280 | 1,423,941,120 |
| Size | 4.5 GB | 1.3 GB |
| Events in quadrant A | 23,435,367 | 9,309,526 |
| Events in quadrant B | 53,272,468 | 9,163,183 |
| Events in quadrant C | 29,299,757 | 8,646,244 |
| Events in quadrant D | 33,489,033 | 8,816,299 |
| Mode M0 | |||
|---|---|---|---|
| Quadrant | BADHDUFLAG | Total packets | Discarded packets |
| A | 0 | 220380 | 0 |
| B | 0 | 324412 | 0 |
| C | 0 | 254258 | 0 |
| D | 0 | 252670 | 0 |
| Mode SS | |||
|---|---|---|---|
| Quadrant | BADHDUFLAG | Total packets | Discarded packets |
| A | 0 | 2140 | 0 |
| B | 0 | 2140 | 0 |
| C | 0 | 2140 | 0 |
| D | 0 | 2140 | 0 |
| Mode M9 | |||
|---|---|---|---|
| Quadrant | BADHDUFLAG | Total packets | Discarded packets |
| A | 0 | 193 | 0 |
| B | 0 | 193 | 0 |
| C | 0 | 193 | 0 |
| D | 0 | 193 | 0 |
| Quadrant | Total seconds | Saturated seconds | Saturation percentage |
|---|---|---|---|
| A | 104987 | 1124 | 1.070609% |
| B | 104987 | 2734 | 2.604132% |
| C | 104987 | 4909 | 4.675817% |
| D | 104987 | 1994 | 1.899283% |
Noise dominated data is calculated using 1-second bins in cleaned event files. If a bin has >2000 counts, and if more than 50% of those come from <1% of pixels, then it is considered to be noise-dominated and hence unusable.
| Quadrant | # 1 sec bins | Bins with >0 counts | Bins with >2000 counts | High rate bins dominated by noise | Noise dominated (total time) | Noise dominated (detector-on time) | Marked lightcurve |
|---|---|---|---|---|---|---|---|
| A | 124332 | 104989 | 0 | 0 | 0.00% | 0.00% |  |
| B | 124332 | 104988 | 6 | 6 | 0.00% | 0.01% |  |
| C | 124332 | 104979 | 17 | 17 | 0.01% | 0.02% |  |
| D | 124332 | 104988 | 73 | 73 | 0.06% | 0.07% | 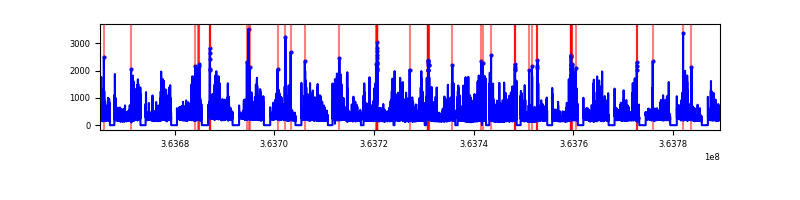 |
Top three noisy pixels from each quadrant. If the there are fewer than three noisy pixels in the level2.evt file, extra rows are filled as -1
| Pixel properties | Quadrant properties | ||||||
|---|---|---|---|---|---|---|---|
| Quadrant | DetID | PixID | Counts | Sigma | Mean | Median | Sigma |
| A | 13 | 254 | 189178 | 141.55 | 6073 | 5996 | 1294.1 |
| A | 0 | 226 | 38102 | 24.81 | 6073 | 5996 | 1294.1 |
| A | 12 | 194 | 36337 | 23.44 | 6073 | 5996 | 1294.1 |
| B | 6 | 159 | 27597712 | 24544.43 | 6014 | 5894 | 1124.2 |
| B | 4 | 80 | 1582076 | 1402.1 | 6014 | 5894 | 1124.2 |
| B | 10 | 245 | 425062 | 372.87 | 6014 | 5894 | 1124.2 |
| C | 3 | 233 | 5599087 | 4272.37 | 5618 | 5617 | 1309.2 |
| C | 0 | 10 | 1255012 | 954.31 | 5618 | 5617 | 1309.2 |
| C | 14 | 254 | 272775 | 204.06 | 5618 | 5617 | 1309.2 |
| D | 8 | 195 | 7536557 | 5404.53 | 5835 | 5708 | 1393.4 |
| D | 12 | 233 | 1466350 | 1048.23 | 5835 | 5708 | 1393.4 |
| D | 2 | 250 | 1109608 | 792.22 | 5835 | 5708 | 1393.4 |
Histogram calculated using DETX and DETY for each event in the final _common_clean file
| Quadrant A |  |
 |
Quadrant B |
|---|---|---|---|
| Quadrant D |  |
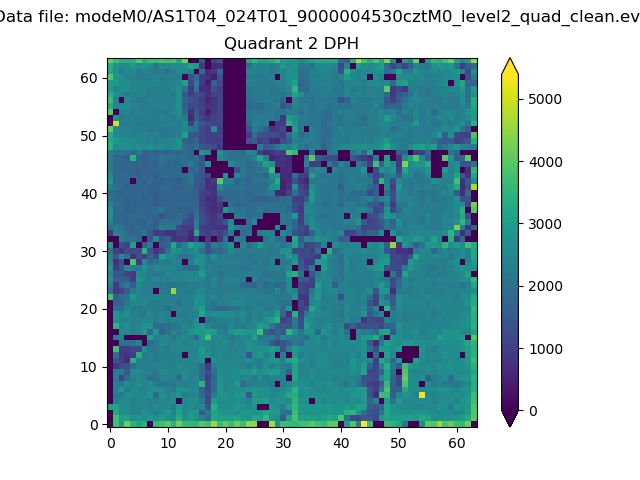 |
Quadrant C |
| Plot type | Count rate plots | Images |
|---|---|---|
| Comparison with Poisson distribution Blue bars denote a histogram of data divided into 1 sec bins. Red curve is a Poisson curve with rate = median count rate of data. |
 |
 |
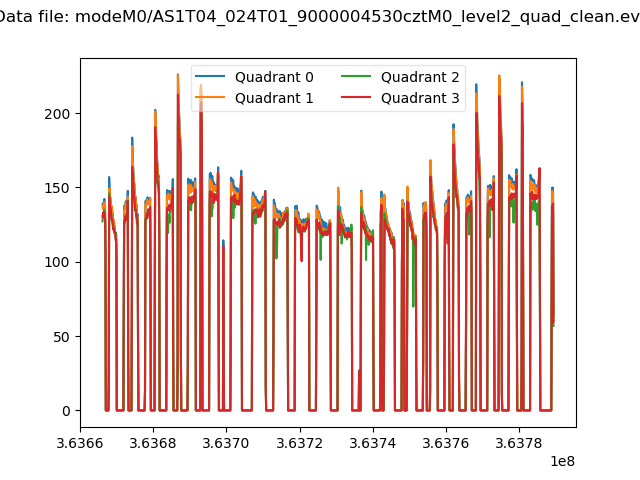
| Quadrant-wise count rates Data is divided into 100 sec bins |
 |
|
| Module-wise count rates for Quadrant A Data is divided into 100 sec bins |
 |
 |
| Module-wise count rates for Quadrant B Data is divided into 100 sec bins |
 |
 |
| Module-wise count rates for Quadrant C Data is divided into 100 sec bins |
 |
 |
| Module-wise count rates for Quadrant D Data is divided into 100 sec bins |
 |
 |
| Parameter | Plot |
|---|---|
| CZT HV Monitor | 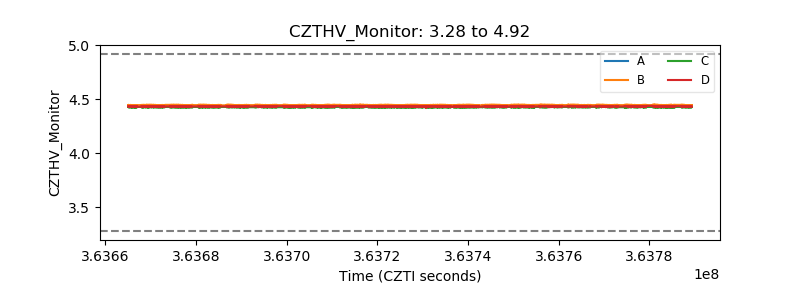 |
| D_VDD |  |
| Temperature 1 |  |
| Veto HV Monitor | 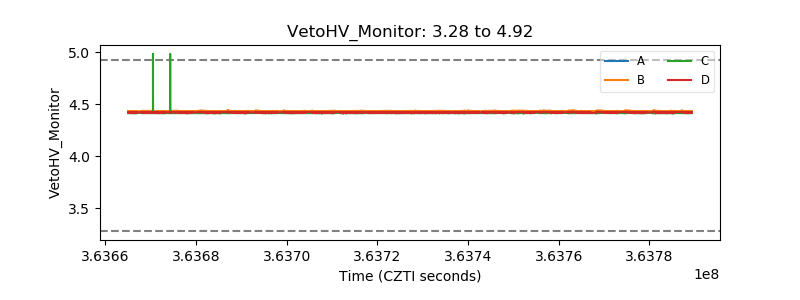 |
| Veto LLD |  |
| Alpha Counter |  |
| _CPM_Rate |  |
| CZT Counter |  |
| +2.5 Volts monitor |  |
| +5 Volts monitor |  |
| _ROLL_ROT |  |
| _Roll_DEC | 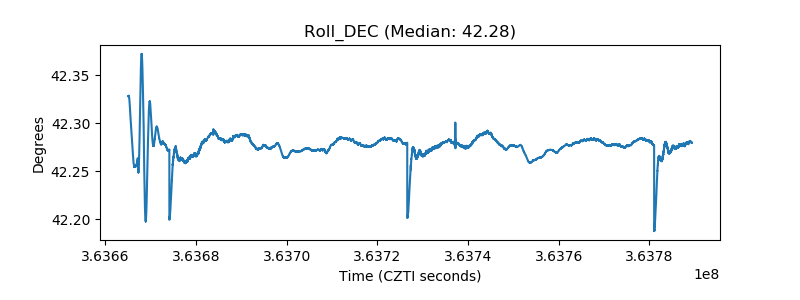 |
| _Roll_RA |  |
| Veto Counter |  |