| Param | Original file | Final file |
|---|---|---|
| Filename | modeM0/AS1T04_021T01_9000004526cztM0_level2_bc.evt | modeM0/AS1T04_021T01_9000004526cztM0_level2_quad_clean.evt |
| Size (bytes) | 1,451,136,960 | 470,839,680 |
| Size | 1.4 GB | 449.0 MB |
| Events in quadrant A | 6,608,849 | 3,201,069 |
| Events in quadrant B | 15,633,938 | 3,097,573 |
| Events in quadrant C | 8,875,035 | 3,013,493 |
| Events in quadrant D | 10,905,900 | 3,007,500 |
| Mode M0 | |||
|---|---|---|---|
| Quadrant | BADHDUFLAG | Total packets | Discarded packets |
| A | 0 | 60707 | 0 |
| B | 0 | 91277 | 0 |
| C | 0 | 72553 | 0 |
| D | 0 | 73905 | 0 |
| Mode M9 | |||
|---|---|---|---|
| Quadrant | BADHDUFLAG | Total packets | Discarded packets |
| A | 0 | 60 | 0 |
| B | 0 | 60 | 0 |
| C | 0 | 60 | 0 |
| D | 0 | 60 | 0 |
| Mode SS | |||
|---|---|---|---|
| Quadrant | BADHDUFLAG | Total packets | Discarded packets |
| A | 0 | 580 | 0 |
| B | 0 | 573 | 0 |
| C | 0 | 578 | 0 |
| D | 0 | 578 | 0 |
| Quadrant | Total seconds | Saturated seconds | Saturation percentage |
|---|---|---|---|
| A | 28286 | 498 | 1.760588% |
| B | 28236 | 1353 | 4.791755% |
| C | 28240 | 1382 | 4.893768% |
| D | 28253 | 684 | 2.420982% |
Noise dominated data is calculated using 1-second bins in cleaned event files. If a bin has >2000 counts, and if more than 50% of those come from <1% of pixels, then it is considered to be noise-dominated and hence unusable.
| Quadrant | # 1 sec bins | Bins with >0 counts | Bins with >2000 counts | High rate bins dominated by noise | Noise dominated (total time) | Noise dominated (detector-on time) | Marked lightcurve |
|---|---|---|---|---|---|---|---|
| A | 34352 | 28392 | 0 | 0 | 0.00% | 0.00% |  |
| B | 34358 | 28376 | 58 | 58 | 0.17% | 0.20% |  |
| C | 34358 | 28371 | 22 | 22 | 0.06% | 0.08% |  |
| D | 34358 | 28375 | 81 | 81 | 0.24% | 0.29% |  |
Top three noisy pixels from each quadrant. If the there are fewer than three noisy pixels in the level2.evt file, extra rows are filled as -1
| Pixel properties | Quadrant properties | ||||||
|---|---|---|---|---|---|---|---|
| Quadrant | DetID | PixID | Counts | Sigma | Mean | Median | Sigma |
| A | 13 | 254 | 50895 | 136.19 | 1711 | 1692 | 361.3 |
| A | 0 | 226 | 10995 | 25.75 | 1711 | 1692 | 361.3 |
| A | 12 | 194 | 10316 | 23.87 | 1711 | 1692 | 361.3 |
| B | 6 | 159 | 7522940 | 23823.97 | 1675 | 1643 | 315.7 |
| B | 0 | 190 | 649337 | 2051.59 | 1675 | 1643 | 315.7 |
| B | 5 | 172 | 299539 | 943.6 | 1675 | 1643 | 315.7 |
| C | 3 | 233 | 2048214 | 5495.76 | 1594 | 1598 | 372.4 |
| C | 0 | 10 | 534994 | 1432.32 | 1594 | 1598 | 372.4 |
| C | 2 | 114 | 53337 | 138.93 | 1594 | 1598 | 372.4 |
| D | 8 | 195 | 3785631 | 9012.2 | 1652 | 1622 | 419.9 |
| D | 12 | 233 | 236698 | 559.87 | 1652 | 1622 | 419.9 |
| D | 2 | 250 | 226103 | 534.64 | 1652 | 1622 | 419.9 |
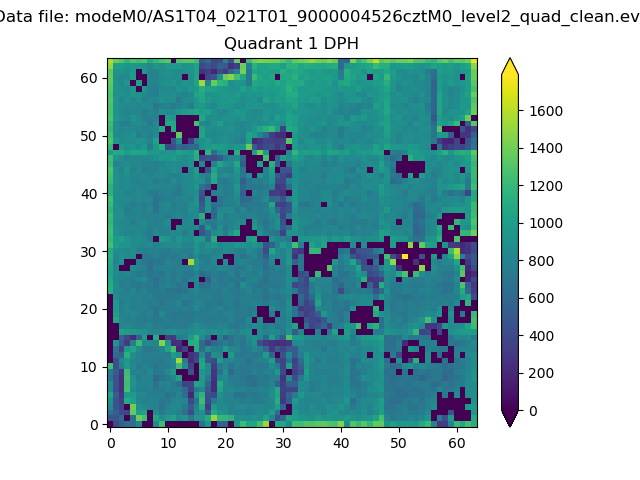
Histogram calculated using DETX and DETY for each event in the final _common_clean file
| Quadrant A |  |
 |
Quadrant B |
|---|---|---|---|
| Quadrant D |  |
 |
Quadrant C |
| Plot type | Count rate plots | Images |
|---|---|---|
| Comparison with Poisson distribution Blue bars denote a histogram of data divided into 1 sec bins. Red curve is a Poisson curve with rate = median count rate of data. |
 |
 |
| Quadrant-wise count rates Data is divided into 100 sec bins |
 |
|
| Module-wise count rates for Quadrant A Data is divided into 100 sec bins |
 |
 |
| Module-wise count rates for Quadrant B Data is divided into 100 sec bins |
 |
 |
| Module-wise count rates for Quadrant C Data is divided into 100 sec bins |
 |
 |
| Module-wise count rates for Quadrant D Data is divided into 100 sec bins |
 |
 |
| Parameter | Plot |
|---|---|
| CZT HV Monitor |  |
| D_VDD | 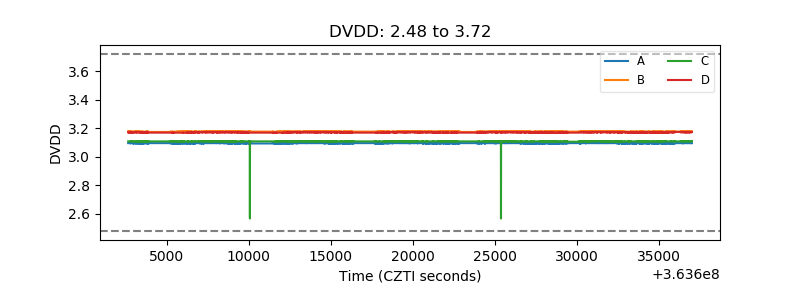 |
| Temperature 1 |  |
| Veto HV Monitor |  |
| Veto LLD |  |
| Alpha Counter |  |
| _CPM_Rate | 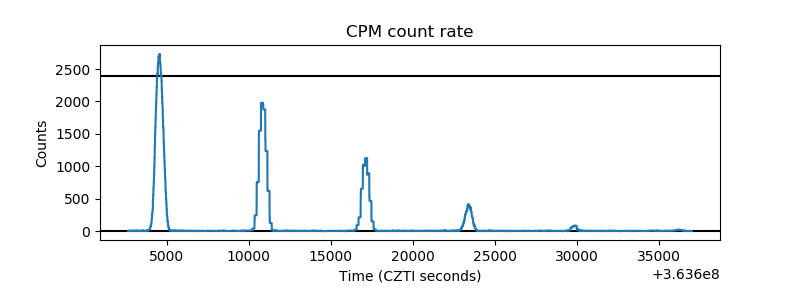 |
| CZT Counter |  |
| +2.5 Volts monitor |  |
| +5 Volts monitor |  |
| _ROLL_ROT |  |
| _Roll_DEC |  |
| _Roll_RA |  |
| Veto Counter |  |