| Param | Original file | Final file |
|---|---|---|
| Filename | modeM0/AS1A10_058T08_9000004528cztM0_level2_bc.evt | modeM0/AS1A10_058T08_9000004528cztM0_level2_quad_clean.evt |
| Size (bytes) | 1,069,741,440 | 311,797,440 |
| Size | 1020.2 MB | 297.4 MB |
| Events in quadrant A | 4,812,688 | 1,998,027 |
| Events in quadrant B | 11,824,413 | 1,977,930 |
| Events in quadrant C | 5,755,615 | 1,911,196 |
| Events in quadrant D | 8,368,012 | 1,906,284 |
| Mode M9 | |||
|---|---|---|---|
| Quadrant | BADHDUFLAG | Total packets | Discarded packets |
| A | 0 | 20 | 0 |
| B | 0 | 20 | 0 |
| C | 0 | 20 | 0 |
| D | 0 | 20 | 0 |
| Mode M0 | |||
|---|---|---|---|
| Quadrant | BADHDUFLAG | Total packets | Discarded packets |
| A | 0 | 49269 | 0 |
| B | 0 | 73119 | 0 |
| C | 0 | 52741 | 0 |
| D | 0 | 59934 | 0 |
| Mode SS | |||
|---|---|---|---|
| Quadrant | BADHDUFLAG | Total packets | Discarded packets |
| A | 0 | 488 | 0 |
| B | 0 | 488 | 0 |
| C | 0 | 488 | 0 |
| D | 0 | 488 | 0 |
| Quadrant | Total seconds | Saturated seconds | Saturation percentage |
|---|---|---|---|
| A | 23989 | 127 | 0.529409% |
| B | 23989 | 459 | 1.913377% |
| C | 23989 | 591 | 2.463629% |
| D | 23989 | 400 | 1.667431% |
Noise dominated data is calculated using 1-second bins in cleaned event files. If a bin has >2000 counts, and if more than 50% of those come from <1% of pixels, then it is considered to be noise-dominated and hence unusable.
| Quadrant | # 1 sec bins | Bins with >0 counts | Bins with >2000 counts | High rate bins dominated by noise | Noise dominated (total time) | Noise dominated (detector-on time) | Marked lightcurve |
|---|---|---|---|---|---|---|---|
| A | 26014 | 23991 | 0 | 0 | 0.00% | 0.00% |  |
| B | 26014 | 23991 | 1 | 1 | 0.00% | 0.00% |  |
| C | 26014 | 23990 | 18 | 18 | 0.07% | 0.08% |  |
| D | 26014 | 23989 | 21 | 21 | 0.08% | 0.09% | 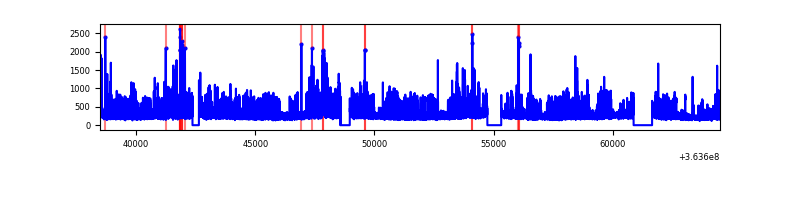 |
Top three noisy pixels from each quadrant. If the there are fewer than three noisy pixels in the level2.evt file, extra rows are filled as -1
| Pixel properties | Quadrant properties | ||||||
|---|---|---|---|---|---|---|---|
| Quadrant | DetID | PixID | Counts | Sigma | Mean | Median | Sigma |
| A | 13 | 254 | 41699 | 148.81 | 1242 | 1218 | 272.0 |
| A | 5 | 16 | 14048 | 47.17 | 1242 | 1218 | 272.0 |
| A | 0 | 226 | 7835 | 24.33 | 1242 | 1218 | 272.0 |
| B | 6 | 159 | 6651608 | 28027.74 | 1236 | 1206 | 237.3 |
| B | 4 | 80 | 153260 | 640.82 | 1236 | 1206 | 237.3 |
| B | 10 | 247 | 104910 | 437.05 | 1236 | 1206 | 237.3 |
| C | 0 | 10 | 598838 | 2148.69 | 1178 | 1174 | 278.2 |
| C | 3 | 233 | 534127 | 1916.04 | 1178 | 1174 | 278.2 |
| C | 2 | 114 | 45412 | 159.04 | 1178 | 1174 | 278.2 |
| D | 8 | 195 | 2829921 | 9243.31 | 1204 | 1170 | 306.0 |
| D | 12 | 233 | 441839 | 1439.94 | 1204 | 1170 | 306.0 |
| D | 2 | 250 | 240235 | 781.17 | 1204 | 1170 | 306.0 |
Histogram calculated using DETX and DETY for each event in the final _common_clean file
| Quadrant A |  |
 |
Quadrant B |
|---|---|---|---|
| Quadrant D | 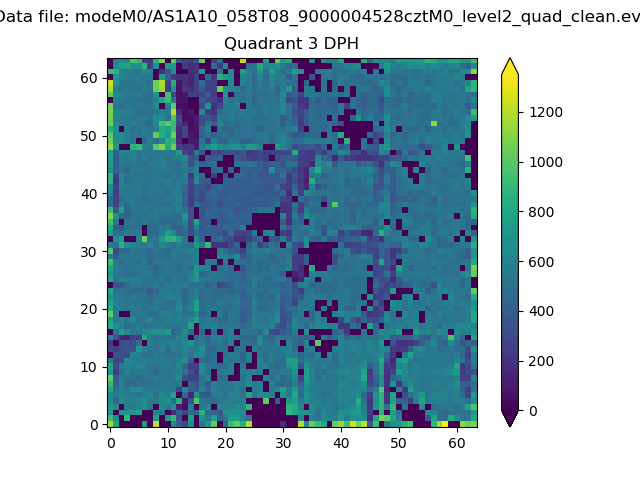 |
 |
Quadrant C |
| Plot type | Count rate plots | Images |
|---|---|---|
| Comparison with Poisson distribution Blue bars denote a histogram of data divided into 1 sec bins. Red curve is a Poisson curve with rate = median count rate of data. |
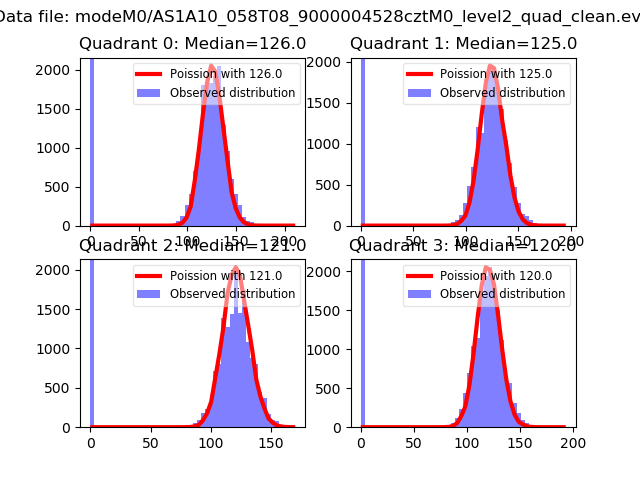 |
 |
| Quadrant-wise count rates Data is divided into 100 sec bins |
 |
|
| Module-wise count rates for Quadrant A Data is divided into 100 sec bins |
 |
 |
| Module-wise count rates for Quadrant B Data is divided into 100 sec bins |
 |
 |
| Module-wise count rates for Quadrant C Data is divided into 100 sec bins |
 |
 |
| Module-wise count rates for Quadrant D Data is divided into 100 sec bins |
 |
 |
| Parameter | Plot |
|---|---|
| CZT HV Monitor | 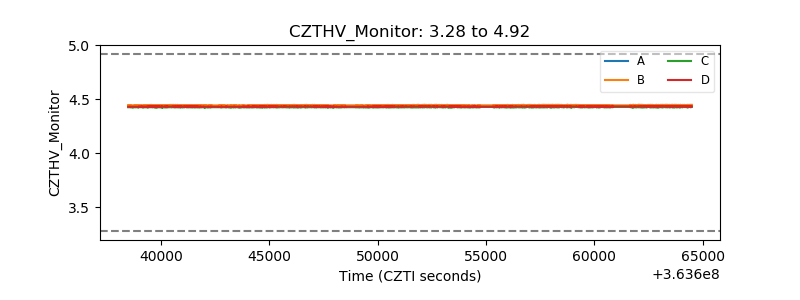 |
| D_VDD |  |
| Temperature 1 |  |
| Veto HV Monitor | 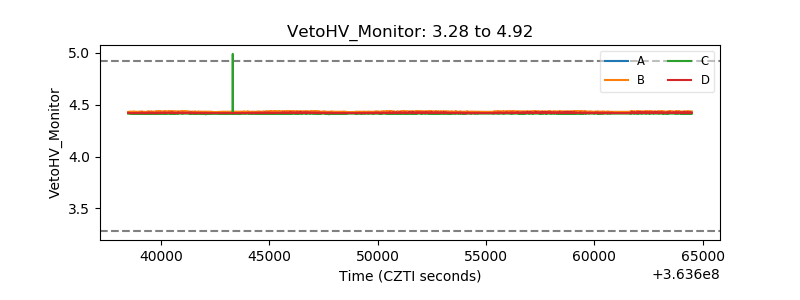 |
| Veto LLD |  |
| Alpha Counter |  |
| _CPM_Rate | 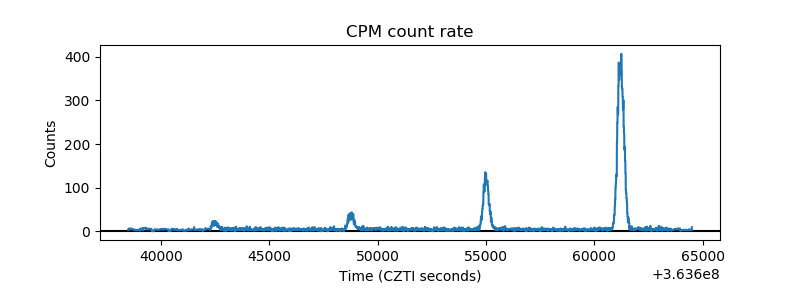 |
| CZT Counter | 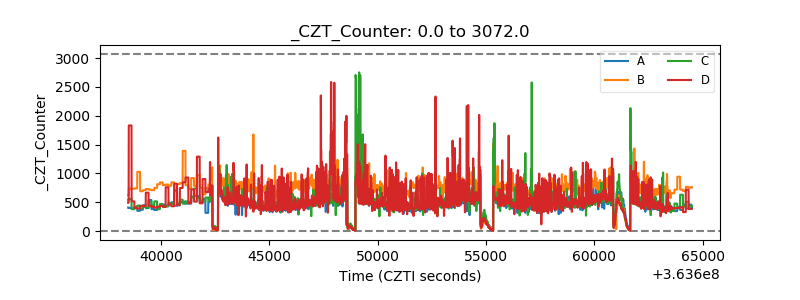 |
| +2.5 Volts monitor |  |
| +5 Volts monitor |  |
| _ROLL_ROT | 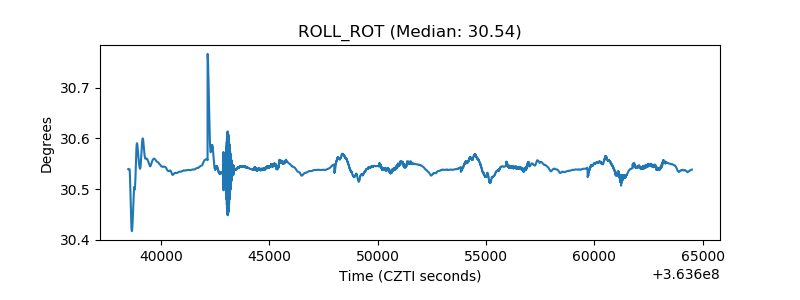 |
| _Roll_DEC |  |
| _Roll_RA | 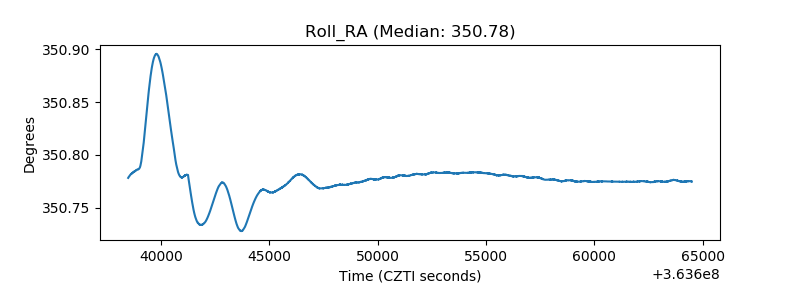 |
| Veto Counter |  |