| Param | Original file | Final file |
|---|---|---|
| Filename | modeM0/AS1A10_113T01_9000004524cztM0_level2_bc.evt | modeM0/AS1A10_113T01_9000004524cztM0_level2_quad_clean.evt |
| Size (bytes) | 1,243,448,640 | 354,553,920 |
| Size | 1.2 GB | 338.1 MB |
| Events in quadrant A | 5,901,855 | 2,258,524 |
| Events in quadrant B | 13,801,016 | 2,233,170 |
| Events in quadrant C | 6,798,321 | 2,150,613 |
| Events in quadrant D | 9,220,676 | 2,143,696 |
| Mode SS | |||
|---|---|---|---|
| Quadrant | BADHDUFLAG | Total packets | Discarded packets |
| A | 0 | 580 | 0 |
| B | 0 | 580 | 0 |
| C | 0 | 580 | 0 |
| D | 0 | 580 | 0 |
| Mode M0 | |||
|---|---|---|---|
| Quadrant | BADHDUFLAG | Total packets | Discarded packets |
| A | 0 | 58272 | 0 |
| B | 0 | 86469 | 0 |
| C | 0 | 62358 | 0 |
| D | 0 | 68608 | 0 |
| Mode M9 | |||
|---|---|---|---|
| Quadrant | BADHDUFLAG | Total packets | Discarded packets |
| A | 0 | 40 | 0 |
| B | 0 | 40 | 0 |
| C | 0 | 40 | 0 |
| D | 0 | 40 | 0 |
| Quadrant | Total seconds | Saturated seconds | Saturation percentage |
|---|---|---|---|
| A | 28395 | 124 | 0.436697% |
| B | 28395 | 447 | 1.574221% |
| C | 28395 | 637 | 2.243353% |
| D | 28395 | 248 | 0.873393% |
Noise dominated data is calculated using 1-second bins in cleaned event files. If a bin has >2000 counts, and if more than 50% of those come from <1% of pixels, then it is considered to be noise-dominated and hence unusable.
| Quadrant | # 1 sec bins | Bins with >0 counts | Bins with >2000 counts | High rate bins dominated by noise | Noise dominated (total time) | Noise dominated (detector-on time) | Marked lightcurve |
|---|---|---|---|---|---|---|---|
| A | 32455 | 28395 | 0 | 0 | 0.00% | 0.00% |  |
| B | 32455 | 28396 | 3 | 3 | 0.01% | 0.01% | 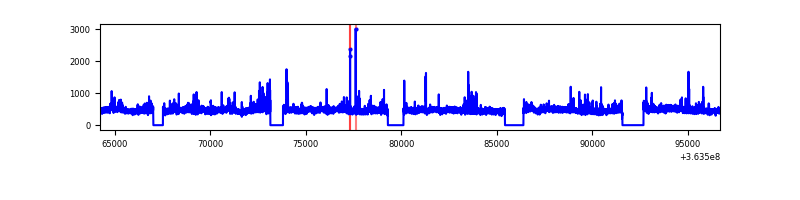 |
| C | 32455 | 28397 | 10 | 10 | 0.03% | 0.04% |  |
| D | 32455 | 28396 | 13 | 13 | 0.04% | 0.05% |  |
Top three noisy pixels from each quadrant. If the there are fewer than three noisy pixels in the level2.evt file, extra rows are filled as -1
| Pixel properties | Quadrant properties | ||||||
|---|---|---|---|---|---|---|---|
| Quadrant | DetID | PixID | Counts | Sigma | Mean | Median | Sigma |
| A | 13 | 254 | 47170 | 139.59 | 1520 | 1493 | 327.2 |
| A | 5 | 16 | 22039 | 62.79 | 1520 | 1493 | 327.2 |
| A | 0 | 226 | 9670 | 24.99 | 1520 | 1493 | 327.2 |
| B | 6 | 159 | 7536664 | 26072.26 | 1518 | 1485 | 289.0 |
| B | 4 | 80 | 166808 | 572.03 | 1518 | 1485 | 289.0 |
| B | 0 | 190 | 104483 | 356.38 | 1518 | 1485 | 289.0 |
| C | 0 | 10 | 756453 | 2203.41 | 1451 | 1445 | 342.7 |
| C | 3 | 233 | 330912 | 961.52 | 1451 | 1445 | 342.7 |
| C | 2 | 114 | 53562 | 152.1 | 1451 | 1445 | 342.7 |
| D | 8 | 195 | 2689535 | 7359.82 | 1480 | 1442 | 365.2 |
| D | 2 | 250 | 388455 | 1059.62 | 1480 | 1442 | 365.2 |
| D | 12 | 233 | 256069 | 697.15 | 1480 | 1442 | 365.2 |
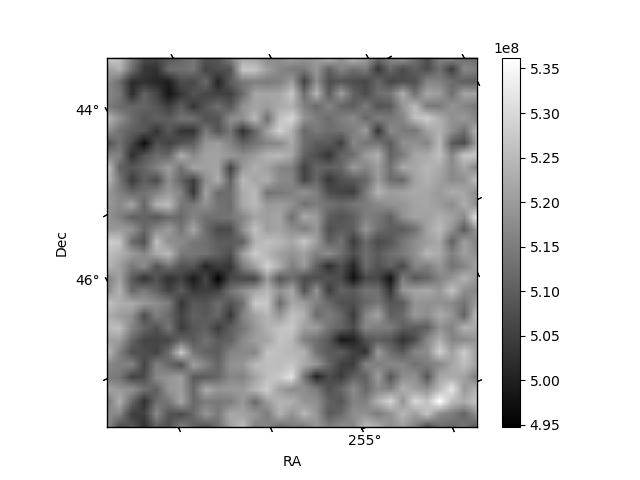
Histogram calculated using DETX and DETY for each event in the final _common_clean file
| Quadrant A |  |
 |
Quadrant B |
|---|---|---|---|
| Quadrant D | 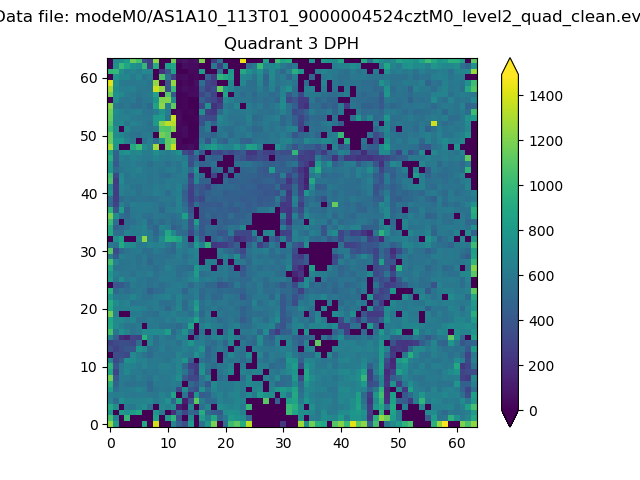 |
 |
Quadrant C |
| Plot type | Count rate plots | Images |
|---|---|---|
| Comparison with Poisson distribution Blue bars denote a histogram of data divided into 1 sec bins. Red curve is a Poisson curve with rate = median count rate of data. |
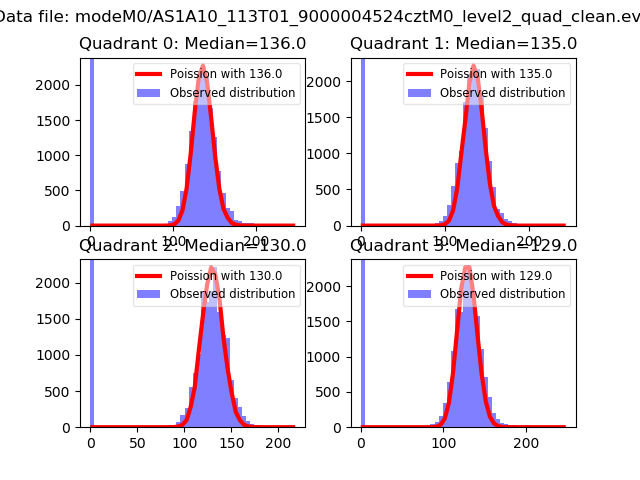 |
 |
| Quadrant-wise count rates Data is divided into 100 sec bins |
 |
|
| Module-wise count rates for Quadrant A Data is divided into 100 sec bins |
 |
 |
| Module-wise count rates for Quadrant B Data is divided into 100 sec bins |
 |
 |
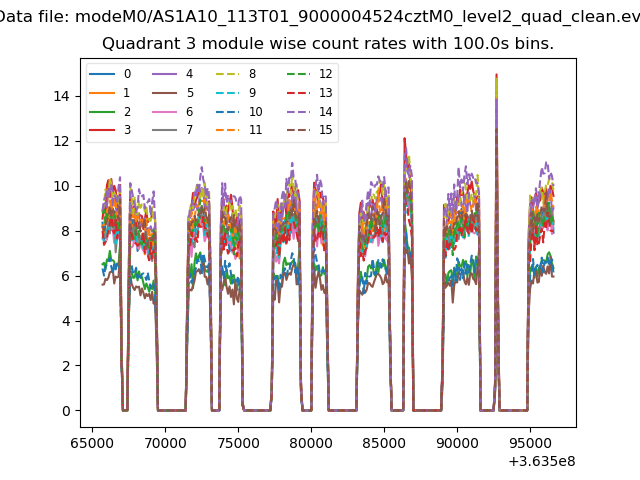
| Module-wise count rates for Quadrant C Data is divided into 100 sec bins |
 |
 |
| Module-wise count rates for Quadrant D Data is divided into 100 sec bins |
 |
 |
| Parameter | Plot |
|---|---|
| CZT HV Monitor | 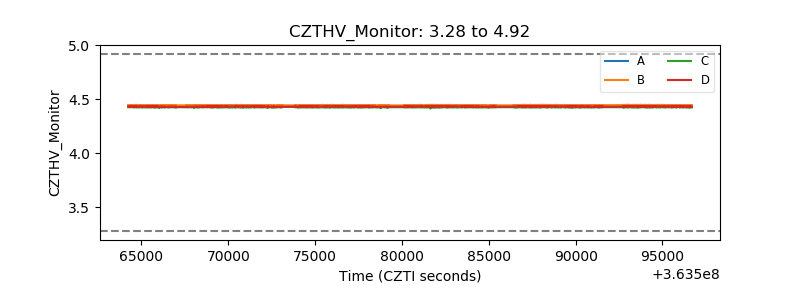 |
| D_VDD |  |
| Temperature 1 |  |
| Veto HV Monitor | 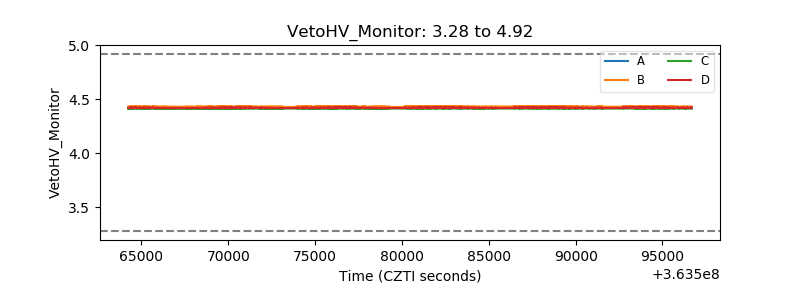 |
| Veto LLD |  |
| Alpha Counter |  |
| _CPM_Rate |  |
| CZT Counter |  |
| +2.5 Volts monitor | 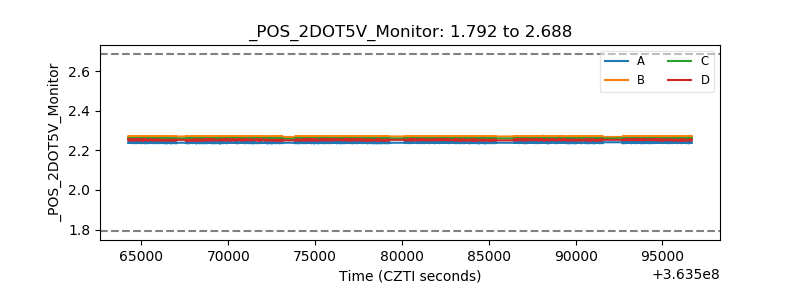 |
| +5 Volts monitor |  |
| _ROLL_ROT |  |
| _Roll_DEC |  |
| _Roll_RA |  |
| Veto Counter |  |