| Param | Original file | Final file |
|---|---|---|
| Filename | modeM0/AS1A10_073T02_9000004522cztM0_level2_bc.evt | modeM0/AS1A10_073T02_9000004522cztM0_level2_quad_clean.evt |
| Size (bytes) | 5,235,773,760 | 1,253,030,400 |
| Size | 4.9 GB | 1.2 GB |
| Events in quadrant A | 20,043,237 | 8,274,940 |
| Events in quadrant B | 47,597,895 | 8,091,936 |
| Events in quadrant C | 24,810,488 | 7,862,508 |
| Events in quadrant D | 59,862,494 | 7,404,402 |
| Mode M9 | |||
|---|---|---|---|
| Quadrant | BADHDUFLAG | Total packets | Discarded packets |
| A | 0 | 131 | 0 |
| B | 0 | 131 | 0 |
| C | 0 | 131 | 0 |
| D | 0 | 131 | 0 |
| Mode SS | |||
|---|---|---|---|
| Quadrant | BADHDUFLAG | Total packets | Discarded packets |
| A | 0 | 1882 | 0 |
| B | 0 | 1886 | 0 |
| C | 0 | 1886 | 0 |
| D | 0 | 1884 | 0 |
| Mode M0 | |||
|---|---|---|---|
| Quadrant | BADHDUFLAG | Total packets | Discarded packets |
| A | 0 | 192918 | 0 |
| B | 0 | 290737 | 0 |
| C | 0 | 214027 | 0 |
| D | 0 | 318524 | 0 |
| Quadrant | Total seconds | Saturated seconds | Saturation percentage |
|---|---|---|---|
| A | 92191 | 822 | 0.891627% |
| B | 92104 | 3213 | 3.488448% |
| C | 92141 | 2919 | 3.167971% |
| D | 92107 | 8326 | 9.039487% |
Noise dominated data is calculated using 1-second bins in cleaned event files. If a bin has >2000 counts, and if more than 50% of those come from <1% of pixels, then it is considered to be noise-dominated and hence unusable.
| Quadrant | # 1 sec bins | Bins with >0 counts | Bins with >2000 counts | High rate bins dominated by noise | Noise dominated (total time) | Noise dominated (detector-on time) | Marked lightcurve |
|---|---|---|---|---|---|---|---|
| A | 106005 | 92365 | 1 | 1 | 0.00% | 0.00% | 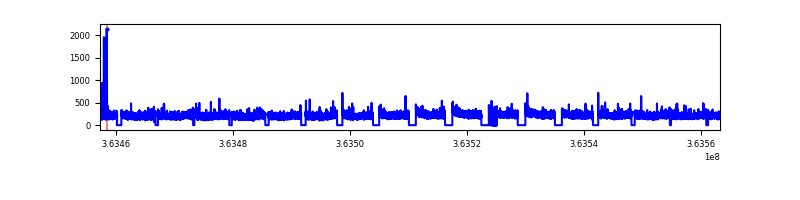 |
| B | 106005 | 92253 | 46 | 46 | 0.04% | 0.05% | 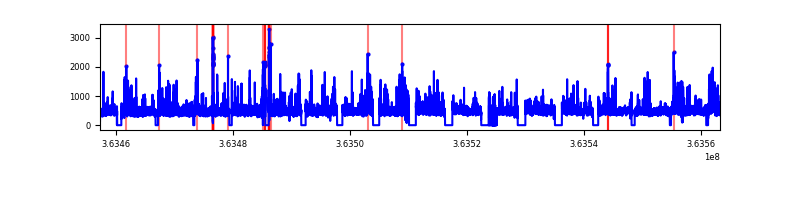 |
| C | 106005 | 92318 | 110 | 110 | 0.10% | 0.12% |  |
| D | 106005 | 92247 | 5033 | 5033 | 4.75% | 5.46% |  |
Top three noisy pixels from each quadrant. If the there are fewer than three noisy pixels in the level2.evt file, extra rows are filled as -1
| Pixel properties | Quadrant properties | ||||||
|---|---|---|---|---|---|---|---|
| Quadrant | DetID | PixID | Counts | Sigma | Mean | Median | Sigma |
| A | 13 | 254 | 167481 | 147.47 | 5136 | 5062 | 1101.3 |
| A | 5 | 16 | 114073 | 98.98 | 5136 | 5062 | 1101.3 |
| A | 11 | 47 | 70079 | 59.03 | 5136 | 5062 | 1101.3 |
| B | 6 | 159 | 24532096 | 25541.53 | 5082 | 4963 | 960.3 |
| B | 0 | 190 | 1263028 | 1310.1 | 5082 | 4963 | 960.3 |
| B | 4 | 80 | 814282 | 842.79 | 5082 | 4963 | 960.3 |
| C | 3 | 233 | 2995421 | 2637.32 | 4855 | 4850 | 1133.9 |
| C | 0 | 10 | 1656362 | 1456.43 | 4855 | 4850 | 1133.9 |
| C | 2 | 16 | 714338 | 625.68 | 4855 | 4850 | 1133.9 |
| D | 8 | 195 | 37781283 | 31542.42 | 4809 | 4699 | 1197.6 |
| D | 2 | 250 | 1082324 | 899.79 | 4809 | 4699 | 1197.6 |
| D | 12 | 233 | 1038934 | 863.56 | 4809 | 4699 | 1197.6 |
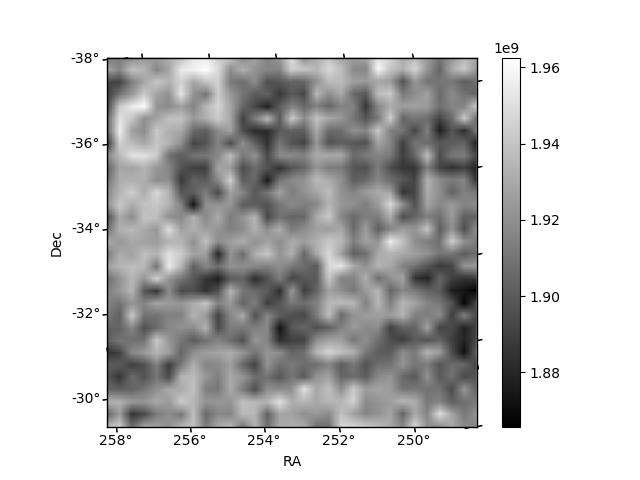
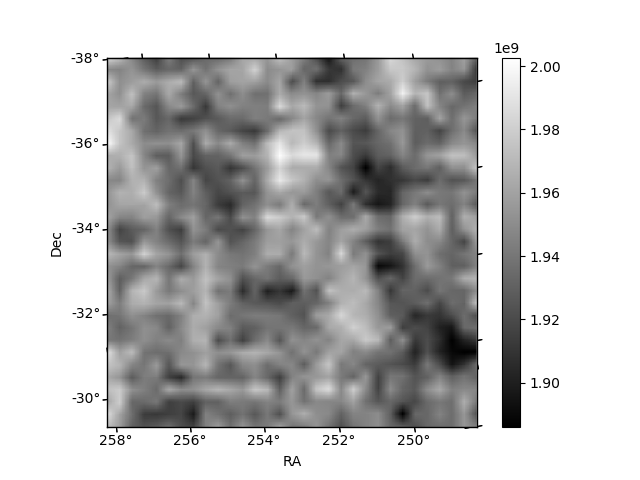
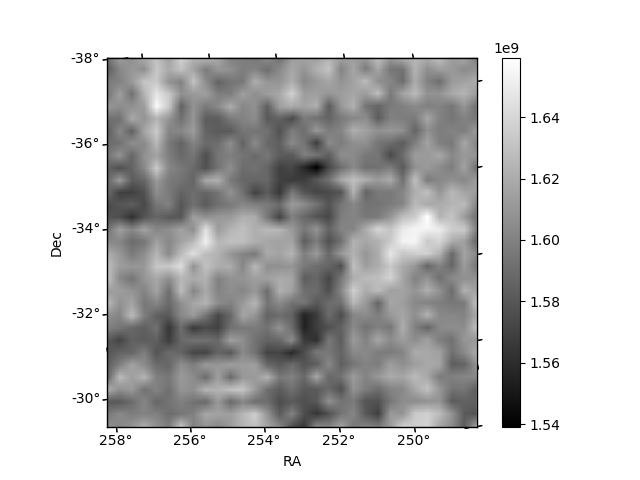
Histogram calculated using DETX and DETY for each event in the final _common_clean file
| Quadrant A | 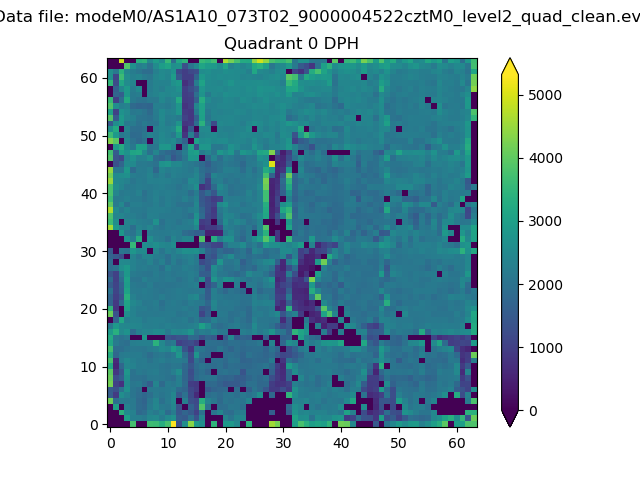 |
 |
Quadrant B |
|---|---|---|---|
| Quadrant D |  |
 |
Quadrant C |
| Plot type | Count rate plots | Images |
|---|---|---|
| Comparison with Poisson distribution Blue bars denote a histogram of data divided into 1 sec bins. Red curve is a Poisson curve with rate = median count rate of data. |
 |
 |
| Quadrant-wise count rates Data is divided into 100 sec bins |
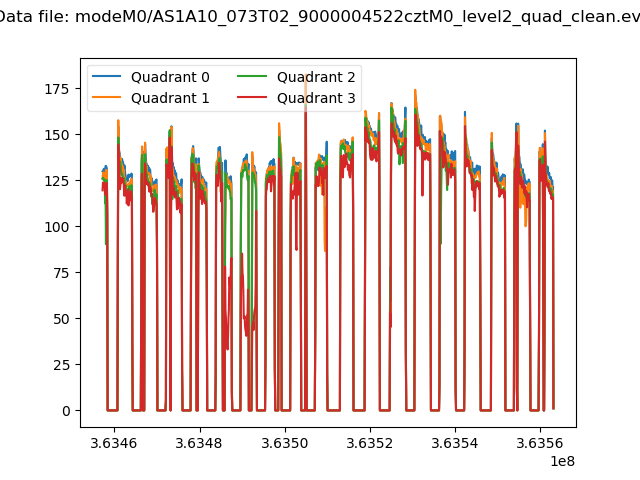 |
|
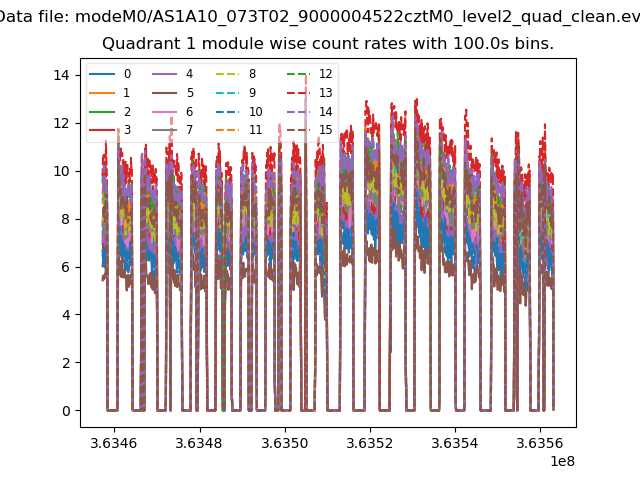
| Module-wise count rates for Quadrant A Data is divided into 100 sec bins |
 |
 |
| Module-wise count rates for Quadrant B Data is divided into 100 sec bins |
 |
 |
| Module-wise count rates for Quadrant C Data is divided into 100 sec bins |
 |
 |
| Module-wise count rates for Quadrant D Data is divided into 100 sec bins |
 |
 |
| Parameter | Plot |
|---|---|
| CZT HV Monitor |  |
| D_VDD |  |
| Temperature 1 |  |
| Veto HV Monitor |  |
| Veto LLD |  |
| Alpha Counter |  |
| _CPM_Rate |  |
| CZT Counter | 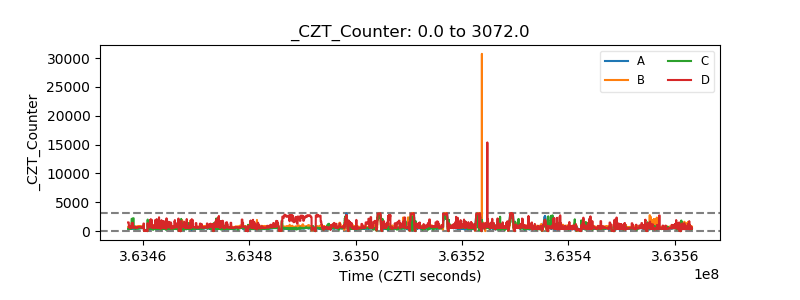 |
| +2.5 Volts monitor |  |
| +5 Volts monitor |  |
| _ROLL_ROT | 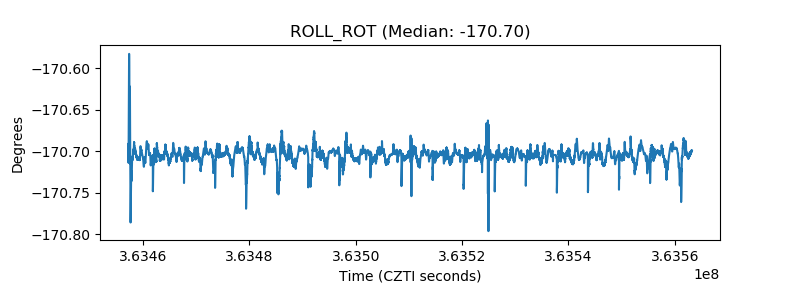 |
| _Roll_DEC |  |
| _Roll_RA |  |
| Veto Counter |  |