| Param | Original file | Final file |
|---|---|---|
| Filename | modeM0/AS1C06_002T02_9000004518cztM0_level2_bc.evt | modeM0/AS1C06_002T02_9000004518cztM0_level2_quad_clean.evt |
| Size (bytes) | 5,846,014,080 | 1,555,686,720 |
| Size | 5.4 GB | 1.4 GB |
| Events in quadrant A | 20,934,943 | 10,783,183 |
| Events in quadrant B | 61,457,132 | 9,910,140 |
| Events in quadrant C | 24,904,024 | 10,192,034 |
| Events in quadrant D | 63,417,279 | 9,827,159 |
| Mode SS | |||
|---|---|---|---|
| Quadrant | BADHDUFLAG | Total packets | Discarded packets |
| A | 0 | 1910 | 0 |
| B | 0 | 1910 | 0 |
| C | 0 | 1910 | 0 |
| D | 0 | 1910 | 0 |
| Mode M9 | |||
|---|---|---|---|
| Quadrant | BADHDUFLAG | Total packets | Discarded packets |
| A | 0 | 167 | 0 |
| B | 0 | 167 | 0 |
| C | 0 | 167 | 0 |
| D | 0 | 167 | 0 |
| Mode M0 | |||
|---|---|---|---|
| Quadrant | BADHDUFLAG | Total packets | Discarded packets |
| A | 0 | 196433 | 0 |
| B | 0 | 342706 | 0 |
| C | 0 | 214455 | 0 |
| D | 0 | 331747 | 0 |
| Quadrant | Total seconds | Saturated seconds | Saturation percentage |
|---|---|---|---|
| A | 93456 | 937 | 1.002611% |
| B | 93458 | 10481 | 11.214663% |
| C | 93460 | 3049 | 3.262358% |
| D | 93457 | 5105 | 5.462405% |
Noise dominated data is calculated using 1-second bins in cleaned event files. If a bin has >2000 counts, and if more than 50% of those come from <1% of pixels, then it is considered to be noise-dominated and hence unusable.
| Quadrant | # 1 sec bins | Bins with >0 counts | Bins with >2000 counts | High rate bins dominated by noise | Noise dominated (total time) | Noise dominated (detector-on time) | Marked lightcurve |
|---|---|---|---|---|---|---|---|
| A | 109670 | 93461 | 5 | 5 | 0.00% | 0.01% | 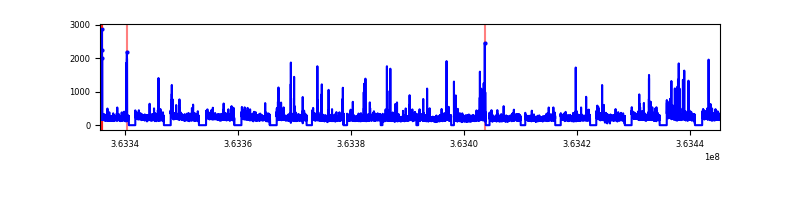 |
| B | 109670 | 93445 | 1823 | 1823 | 1.66% | 1.95% |  |
| C | 109670 | 93457 | 39 | 39 | 0.04% | 0.04% |  |
| D | 109670 | 93460 | 1121 | 1121 | 1.02% | 1.20% |  |
Top three noisy pixels from each quadrant. If the there are fewer than three noisy pixels in the level2.evt file, extra rows are filled as -1
| Pixel properties | Quadrant properties | ||||||
|---|---|---|---|---|---|---|---|
| Quadrant | DetID | PixID | Counts | Sigma | Mean | Median | Sigma |
| A | 12 | 96 | 247441 | 212.63 | 5312 | 5243 | 1139.0 |
| A | 13 | 254 | 177892 | 151.57 | 5312 | 5243 | 1139.0 |
| A | 5 | 16 | 94322 | 78.21 | 5312 | 5243 | 1139.0 |
| B | 6 | 159 | 25026001 | 26691.29 | 4980 | 4881 | 937.4 |
| B | 14 | 167 | 8526859 | 9090.82 | 4980 | 4881 | 937.4 |
| B | 4 | 80 | 5537477 | 5901.9 | 4980 | 4881 | 937.4 |
| C | 0 | 10 | 3078330 | 2602.32 | 4986 | 4986 | 1181.0 |
| C | 10 | 22 | 738751 | 621.31 | 4986 | 4986 | 1181.0 |
| C | 3 | 233 | 732966 | 616.41 | 4986 | 4986 | 1181.0 |
| D | 8 | 195 | 37736463 | 29344.66 | 5075 | 4982 | 1285.8 |
| D | 12 | 79 | 1393687 | 1080.03 | 5075 | 4982 | 1285.8 |
| D | 12 | 218 | 962733 | 744.87 | 5075 | 4982 | 1285.8 |
Histogram calculated using DETX and DETY for each event in the final _common_clean file
| Quadrant A | 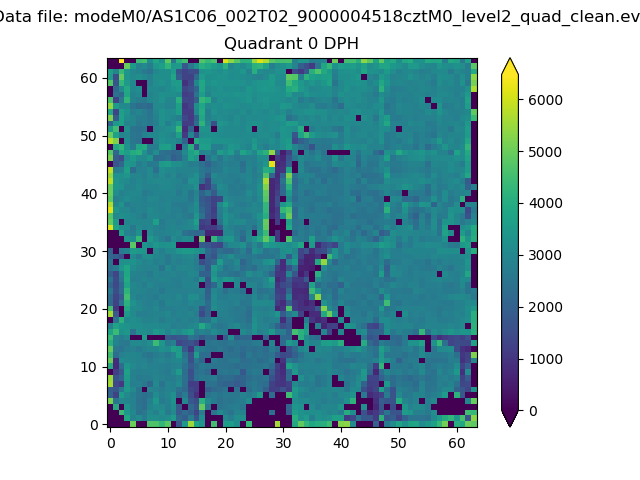 |
 |
Quadrant B |
|---|---|---|---|
| Quadrant D |  |
 |
Quadrant C |
| Plot type | Count rate plots | Images |
|---|---|---|
| Comparison with Poisson distribution Blue bars denote a histogram of data divided into 1 sec bins. Red curve is a Poisson curve with rate = median count rate of data. |
 |
 |
| Quadrant-wise count rates Data is divided into 100 sec bins |
 |
|
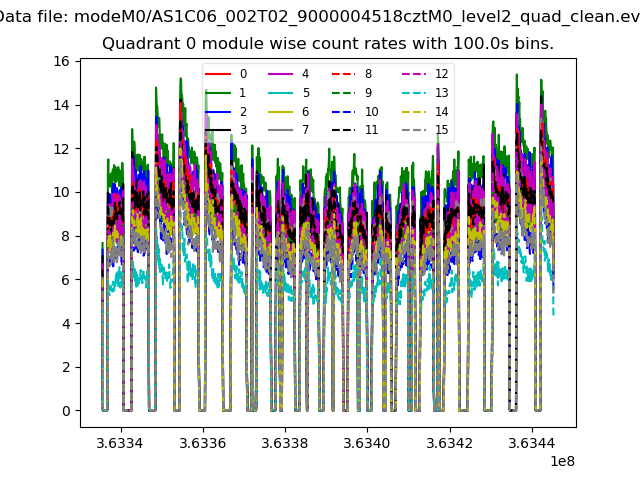
| Module-wise count rates for Quadrant A Data is divided into 100 sec bins |
 |
 |
| Module-wise count rates for Quadrant B Data is divided into 100 sec bins |
 |
 |
| Module-wise count rates for Quadrant C Data is divided into 100 sec bins |
 |
 |
| Module-wise count rates for Quadrant D Data is divided into 100 sec bins |
 |
 |
| Parameter | Plot |
|---|---|
| CZT HV Monitor | 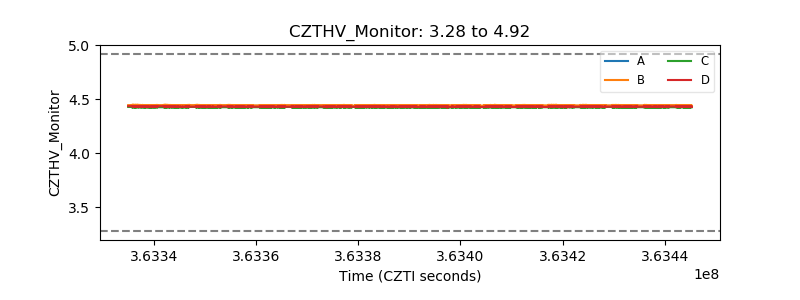 |
| D_VDD |  |
| Temperature 1 |  |
| Veto HV Monitor |  |
| Veto LLD |  |
| Alpha Counter |  |
| _CPM_Rate |  |
| CZT Counter |  |
| +2.5 Volts monitor |  |
| +5 Volts monitor | 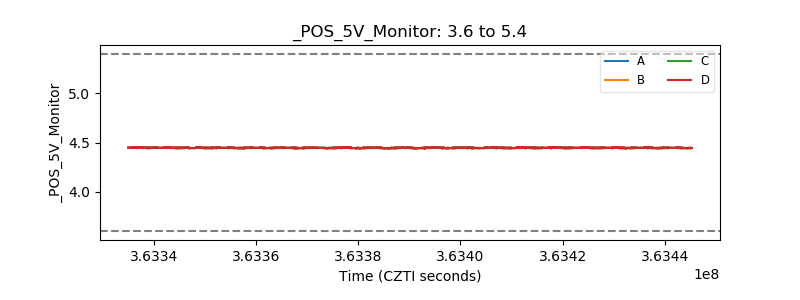 |
| _ROLL_ROT | 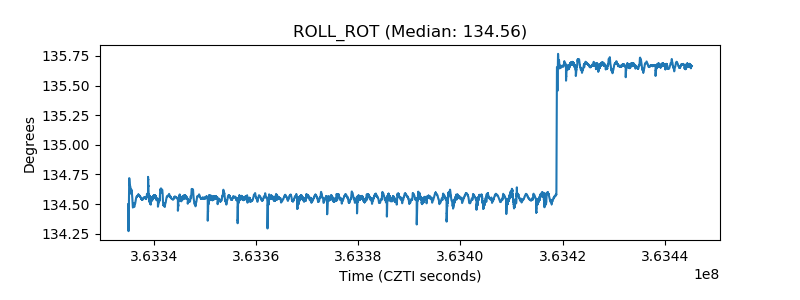 |
| _Roll_DEC |  |
| _Roll_RA |  |
| Veto Counter |  |