| Param | Original file | Final file |
|---|---|---|
| Filename | modeM0/AS1T04_019T01_9000004516cztM0_level2_bc.evt | modeM0/AS1T04_019T01_9000004516cztM0_level2_quad_clean.evt |
| Size (bytes) | 2,627,588,160 | 659,116,800 |
| Size | 2.4 GB | 628.6 MB |
| Events in quadrant A | 10,471,073 | 4,245,637 |
| Events in quadrant B | 25,348,761 | 4,211,264 |
| Events in quadrant C | 11,491,824 | 4,064,244 |
| Events in quadrant D | 28,843,284 | 3,985,400 |
| Mode SS | |||
|---|---|---|---|
| Quadrant | BADHDUFLAG | Total packets | Discarded packets |
| A | 0 | 1028 | 0 |
| B | 0 | 1028 | 0 |
| C | 0 | 1028 | 0 |
| D | 0 | 1028 | 0 |
| Mode M9 | |||
|---|---|---|---|
| Quadrant | BADHDUFLAG | Total packets | Discarded packets |
| A | 0 | 55 | 0 |
| B | 0 | 55 | 0 |
| C | 0 | 55 | 0 |
| D | 0 | 55 | 0 |
| Mode M0 | |||
|---|---|---|---|
| Quadrant | BADHDUFLAG | Total packets | Discarded packets |
| A | 0 | 104863 | 0 |
| B | 0 | 153631 | 0 |
| C | 0 | 110340 | 0 |
| D | 0 | 162270 | 0 |
| Quadrant | Total seconds | Saturated seconds | Saturation percentage |
|---|---|---|---|
| A | 50364 | 691 | 1.372012% |
| B | 50364 | 1515 | 3.008101% |
| C | 50364 | 1577 | 3.131205% |
| D | 50364 | 1555 | 3.087523% |
Noise dominated data is calculated using 1-second bins in cleaned event files. If a bin has >2000 counts, and if more than 50% of those come from <1% of pixels, then it is considered to be noise-dominated and hence unusable.
| Quadrant | # 1 sec bins | Bins with >0 counts | Bins with >2000 counts | High rate bins dominated by noise | Noise dominated (total time) | Noise dominated (detector-on time) | Marked lightcurve |
|---|---|---|---|---|---|---|---|
| A | 55024 | 50365 | 0 | 0 | 0.00% | 0.00% |  |
| B | 55023 | 50362 | 0 | 0 | 0.00% | 0.00% |  |
| C | 55023 | 50363 | 12 | 12 | 0.02% | 0.02% |  |
| D | 55023 | 50361 | 276 | 276 | 0.50% | 0.55% | 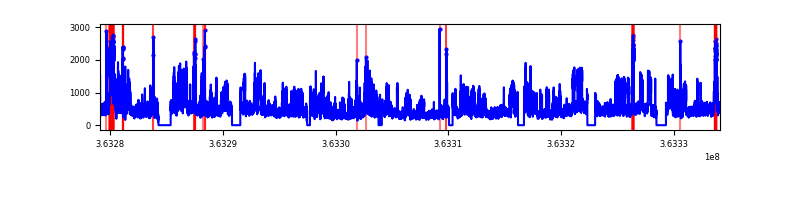 |
Top three noisy pixels from each quadrant. If the there are fewer than three noisy pixels in the level2.evt file, extra rows are filled as -1
| Pixel properties | Quadrant properties | ||||||
|---|---|---|---|---|---|---|---|
| Quadrant | DetID | PixID | Counts | Sigma | Mean | Median | Sigma |
| A | 13 | 254 | 76907 | 126.76 | 2707 | 2659 | 585.8 |
| A | 5 | 16 | 29464 | 45.76 | 2707 | 2659 | 585.8 |
| A | 0 | 226 | 16739 | 24.04 | 2707 | 2659 | 585.8 |
| B | 6 | 159 | 14727510 | 28292.92 | 2699 | 2626 | 520.4 |
| B | 0 | 190 | 158753 | 299.99 | 2699 | 2626 | 520.4 |
| B | 0 | 230 | 97576 | 182.44 | 2699 | 2626 | 520.4 |
| C | 3 | 233 | 414080 | 671.99 | 2599 | 2587 | 612.3 |
| C | 0 | 10 | 399182 | 647.66 | 2599 | 2587 | 612.3 |
| C | 10 | 22 | 392579 | 636.88 | 2599 | 2587 | 612.3 |
| D | 8 | 195 | 18079849 | 29895.88 | 2634 | 2565 | 604.7 |
| D | 2 | 72 | 297224 | 487.3 | 2634 | 2565 | 604.7 |
| D | 11 | 176 | 199988 | 326.49 | 2634 | 2565 | 604.7 |
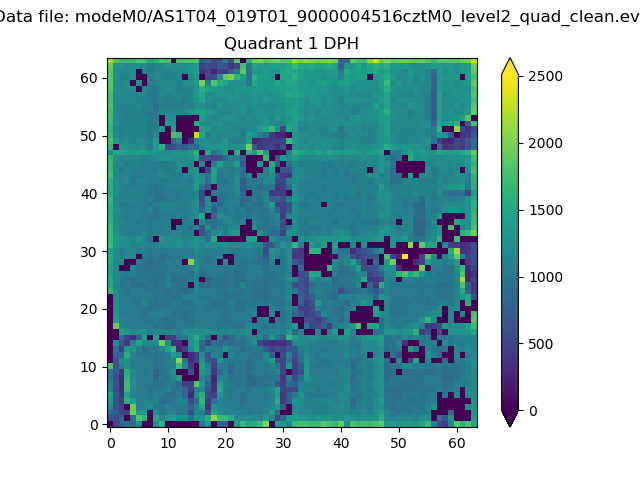
Histogram calculated using DETX and DETY for each event in the final _common_clean file
| Quadrant A |  |
 |
Quadrant B |
|---|---|---|---|
| Quadrant D |  |
 |
Quadrant C |
| Plot type | Count rate plots | Images |
|---|---|---|
| Comparison with Poisson distribution Blue bars denote a histogram of data divided into 1 sec bins. Red curve is a Poisson curve with rate = median count rate of data. |
 |
 |
| Quadrant-wise count rates Data is divided into 100 sec bins |
 |
|
| Module-wise count rates for Quadrant A Data is divided into 100 sec bins |
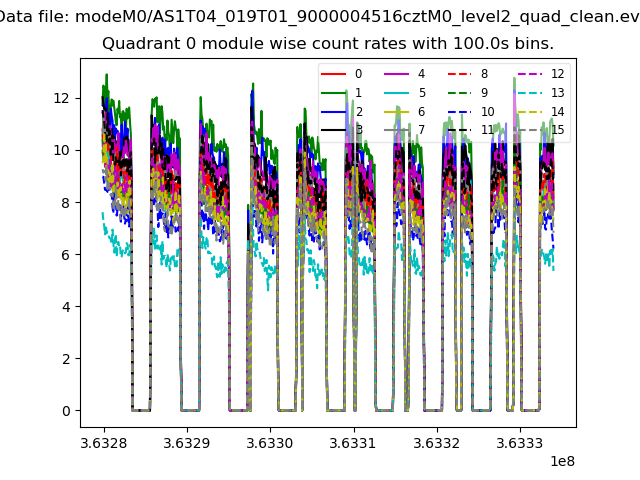 |
 |
| Module-wise count rates for Quadrant B Data is divided into 100 sec bins |
 |
 |
| Module-wise count rates for Quadrant C Data is divided into 100 sec bins |
 |
 |
| Module-wise count rates for Quadrant D Data is divided into 100 sec bins |
 |
 |
| Parameter | Plot |
|---|---|
| CZT HV Monitor |  |
| D_VDD | 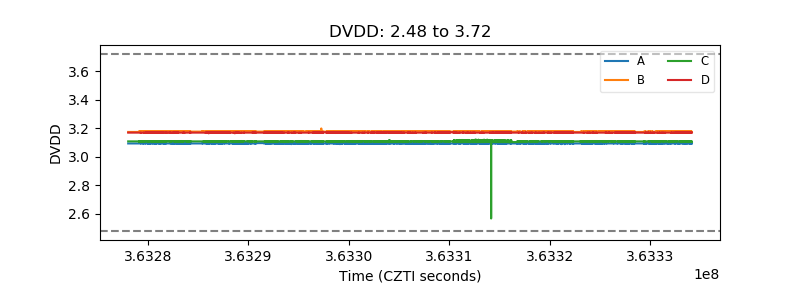 |
| Temperature 1 |  |
| Veto HV Monitor | 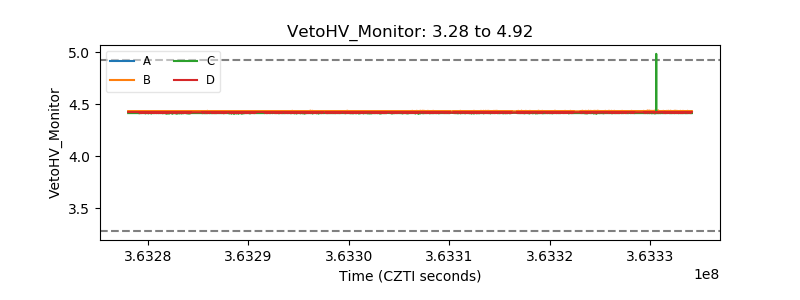 |
| Veto LLD |  |
| Alpha Counter |  |
| _CPM_Rate |  |
| CZT Counter |  |
| +2.5 Volts monitor | 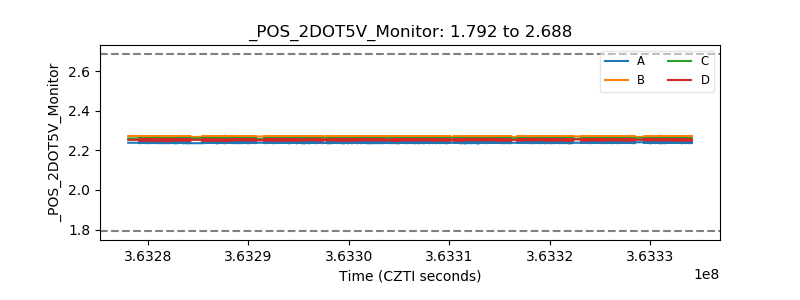 |
| +5 Volts monitor |  |
| _ROLL_ROT |  |
| _Roll_DEC |  |
| _Roll_RA |  |
| Veto Counter |  |