| Param | Original file | Final file |
|---|---|---|
| Filename | modeM0/AS1A10_103T02_9000004514cztM0_level2_bc.evt | modeM0/AS1A10_103T02_9000004514cztM0_level2_quad_clean.evt |
| Size (bytes) | 2,074,677,120 | 528,966,720 |
| Size | 1.9 GB | 504.5 MB |
| Events in quadrant A | 7,850,801 | 3,481,960 |
| Events in quadrant B | 21,560,249 | 3,288,236 |
| Events in quadrant C | 8,211,085 | 3,353,488 |
| Events in quadrant D | 22,563,378 | 3,225,217 |
| Mode M9 | |||
|---|---|---|---|
| Quadrant | BADHDUFLAG | Total packets | Discarded packets |
| A | 0 | 88 | 0 |
| B | 0 | 88 | 0 |
| C | 0 | 88 | 0 |
| D | 0 | 88 | 0 |
| Mode SS | |||
|---|---|---|---|
| Quadrant | BADHDUFLAG | Total packets | Discarded packets |
| A | 0 | 796 | 0 |
| B | 0 | 796 | 0 |
| C | 0 | 796 | 0 |
| D | 0 | 796 | 0 |
| Mode M0 | |||
|---|---|---|---|
| Quadrant | BADHDUFLAG | Total packets | Discarded packets |
| A | 0 | 79208 | 0 |
| B | 0 | 131743 | 0 |
| C | 0 | 81388 | 0 |
| D | 0 | 126355 | 0 |
| Quadrant | Total seconds | Saturated seconds | Saturation percentage |
|---|---|---|---|
| A | 38896 | 173 | 0.444776% |
| B | 38891 | 2907 | 7.474737% |
| C | 38903 | 606 | 1.557720% |
| D | 38898 | 2010 | 5.167361% |
Noise dominated data is calculated using 1-second bins in cleaned event files. If a bin has >2000 counts, and if more than 50% of those come from <1% of pixels, then it is considered to be noise-dominated and hence unusable.
| Quadrant | # 1 sec bins | Bins with >0 counts | Bins with >2000 counts | High rate bins dominated by noise | Noise dominated (total time) | Noise dominated (detector-on time) | Marked lightcurve |
|---|---|---|---|---|---|---|---|
| A | 42306 | 38761 | 0 | 0 | 0.00% | 0.00% |  |
| B | 42306 | 38756 | 47 | 47 | 0.11% | 0.12% |  |
| C | 42306 | 38760 | 4 | 4 | 0.01% | 0.01% |  |
| D | 42305 | 38754 | 539 | 539 | 1.27% | 1.39% |  |
Top three noisy pixels from each quadrant. If the there are fewer than three noisy pixels in the level2.evt file, extra rows are filled as -1
| Pixel properties | Quadrant properties | ||||||
|---|---|---|---|---|---|---|---|
| Quadrant | DetID | PixID | Counts | Sigma | Mean | Median | Sigma |
| A | 13 | 254 | 65448 | 142.79 | 2033 | 1999 | 444.4 |
| A | 0 | 226 | 12744 | 24.18 | 2033 | 1999 | 444.4 |
| A | 12 | 194 | 12030 | 22.57 | 2033 | 1999 | 444.4 |
| B | 6 | 159 | 10240676 | 27153.99 | 1972 | 1926 | 377.1 |
| B | 4 | 80 | 3261008 | 8643.35 | 1972 | 1926 | 377.1 |
| B | 0 | 190 | 195817 | 514.21 | 1972 | 1926 | 377.1 |
| C | 10 | 22 | 268417 | 570.67 | 1960 | 1956 | 466.9 |
| C | 4 | 175 | 138662 | 292.78 | 1960 | 1956 | 466.9 |
| C | 0 | 10 | 109846 | 231.07 | 1960 | 1956 | 466.9 |
| D | 8 | 195 | 11605912 | 24418.93 | 1942 | 1891 | 475.2 |
| D | 12 | 79 | 2854490 | 6002.87 | 1942 | 1891 | 475.2 |
| D | 2 | 250 | 275830 | 576.46 | 1942 | 1891 | 475.2 |
Histogram calculated using DETX and DETY for each event in the final _common_clean file
| Quadrant A |  |
 |
Quadrant B |
|---|---|---|---|
| Quadrant D |  |
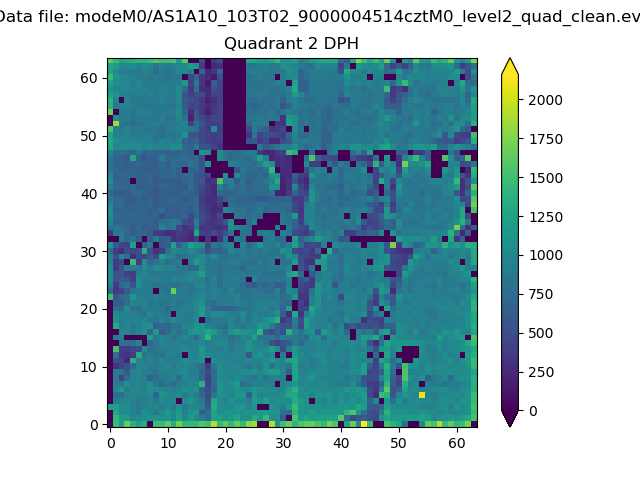 |
Quadrant C |
| Plot type | Count rate plots | Images |
|---|---|---|
| Comparison with Poisson distribution Blue bars denote a histogram of data divided into 1 sec bins. Red curve is a Poisson curve with rate = median count rate of data. |
 |
 |
| Quadrant-wise count rates Data is divided into 100 sec bins |
 |
|
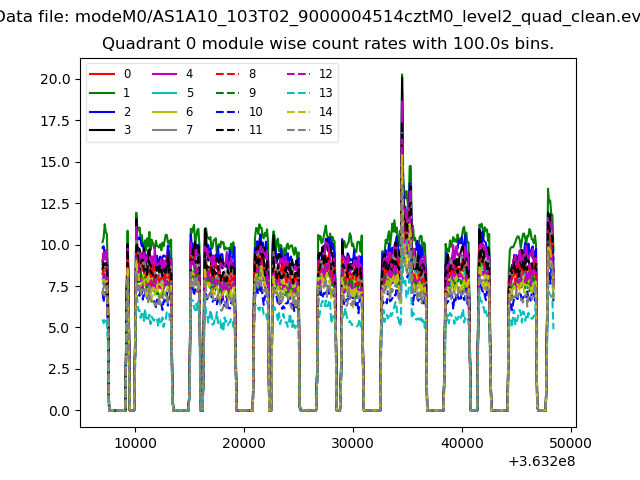
| Module-wise count rates for Quadrant A Data is divided into 100 sec bins |
 |
 |
| Module-wise count rates for Quadrant B Data is divided into 100 sec bins |
 |
 |
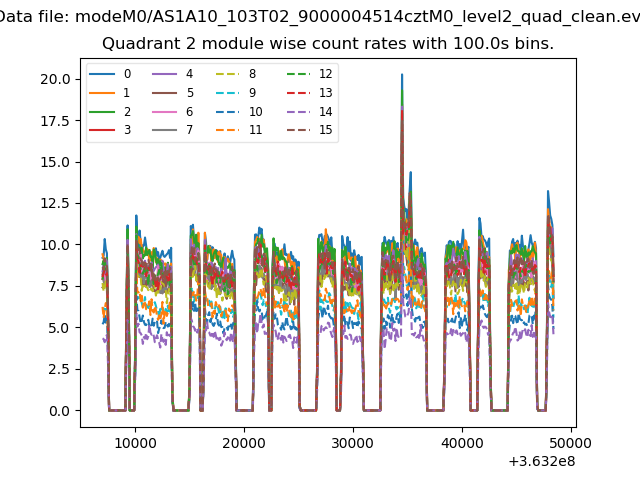
| Module-wise count rates for Quadrant C Data is divided into 100 sec bins |
 |
 |
| Module-wise count rates for Quadrant D Data is divided into 100 sec bins |
 |
 |
| Parameter | Plot |
|---|---|
| CZT HV Monitor |  |
| D_VDD |  |
| Temperature 1 |  |
| Veto HV Monitor |  |
| Veto LLD |  |
| Alpha Counter |  |
| _CPM_Rate |  |
| CZT Counter | 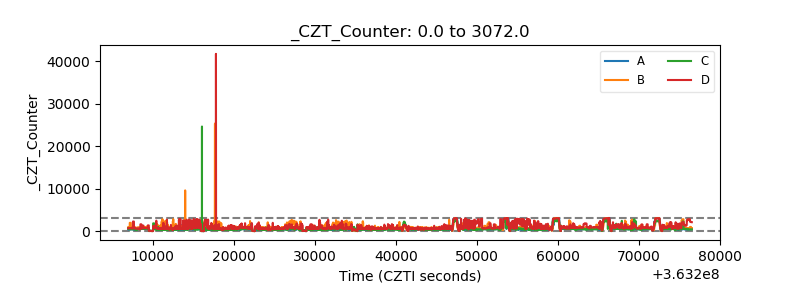 |
| +2.5 Volts monitor | 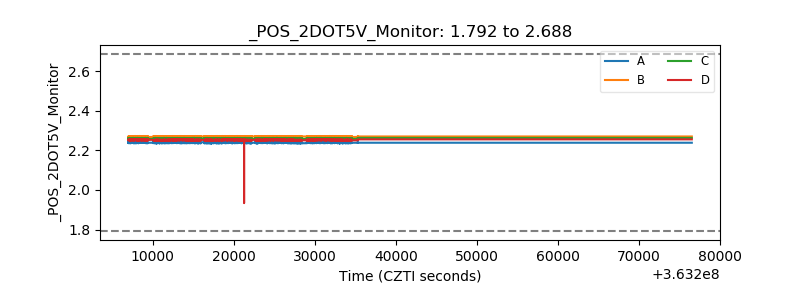 |
| +5 Volts monitor |  |
| _ROLL_ROT |  |
| _Roll_DEC |  |
| _Roll_RA |  |
| Veto Counter |  |