| Param | Original file | Final file |
|---|---|---|
| Filename | modeM0/AS1A10_082T10_9000004512cztM0_level2_bc.evt | modeM0/AS1A10_082T10_9000004512cztM0_level2_quad_clean.evt |
| Size (bytes) | 1,672,554,240 | 434,505,600 |
| Size | 1.6 GB | 414.4 MB |
| Events in quadrant A | 6,456,890 | 2,965,405 |
| Events in quadrant B | 16,127,664 | 2,849,670 |
| Events in quadrant C | 7,040,481 | 2,803,996 |
| Events in quadrant D | 19,183,223 | 2,674,973 |
| Mode M0 | |||
|---|---|---|---|
| Quadrant | BADHDUFLAG | Total packets | Discarded packets |
| A | 0 | 58330 | 0 |
| B | 0 | 92596 | 0 |
| C | 0 | 61381 | 0 |
| D | 0 | 103315 | 0 |
| Mode SS | |||
|---|---|---|---|
| Quadrant | BADHDUFLAG | Total packets | Discarded packets |
| A | 0 | 556 | 0 |
| B | 0 | 556 | 0 |
| C | 0 | 556 | 0 |
| D | 0 | 556 | 0 |
| Mode M9 | |||
|---|---|---|---|
| Quadrant | BADHDUFLAG | Total packets | Discarded packets |
| A | 0 | 70 | 0 |
| B | 0 | 70 | 0 |
| C | 0 | 70 | 0 |
| D | 0 | 70 | 0 |
| Quadrant | Total seconds | Saturated seconds | Saturation percentage |
|---|---|---|---|
| A | 27130 | 576 | 2.123111% |
| B | 27130 | 2196 | 8.094360% |
| C | 27130 | 1000 | 3.685957% |
| D | 27130 | 2314 | 8.529303% |
Noise dominated data is calculated using 1-second bins in cleaned event files. If a bin has >2000 counts, and if more than 50% of those come from <1% of pixels, then it is considered to be noise-dominated and hence unusable.
| Quadrant | # 1 sec bins | Bins with >0 counts | Bins with >2000 counts | High rate bins dominated by noise | Noise dominated (total time) | Noise dominated (detector-on time) | Marked lightcurve |
|---|---|---|---|---|---|---|---|
| A | 34215 | 27131 | 0 | 0 | 0.00% | 0.00% | 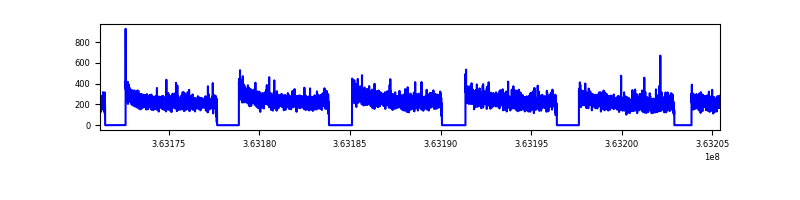 |
| B | 34214 | 27128 | 39 | 39 | 0.11% | 0.14% |  |
| C | 34215 | 27129 | 35 | 35 | 0.10% | 0.13% |  |
| D | 34215 | 27126 | 314 | 314 | 0.92% | 1.16% | 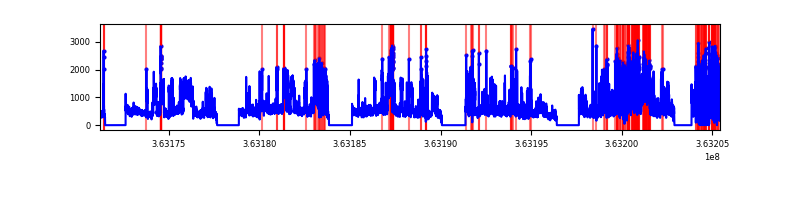 |
Top three noisy pixels from each quadrant. If the there are fewer than three noisy pixels in the level2.evt file, extra rows are filled as -1
| Pixel properties | Quadrant properties | ||||||
|---|---|---|---|---|---|---|---|
| Quadrant | DetID | PixID | Counts | Sigma | Mean | Median | Sigma |
| A | 13 | 254 | 50495 | 138.82 | 1669 | 1648 | 351.9 |
| A | 0 | 226 | 10717 | 25.77 | 1669 | 1648 | 351.9 |
| A | 12 | 194 | 10226 | 24.38 | 1669 | 1648 | 351.9 |
| B | 6 | 159 | 7415271 | 24563.2 | 1611 | 1583 | 301.8 |
| B | 4 | 80 | 1720341 | 5694.63 | 1611 | 1583 | 301.8 |
| B | 0 | 190 | 290548 | 957.41 | 1611 | 1583 | 301.8 |
| C | 0 | 10 | 674267 | 1839.79 | 1572 | 1574 | 365.6 |
| C | 4 | 175 | 136089 | 367.89 | 1572 | 1574 | 365.6 |
| C | 10 | 22 | 93526 | 251.49 | 1572 | 1574 | 365.6 |
| D | 8 | 195 | 9956767 | 25364.55 | 1562 | 1532 | 392.5 |
| D | 12 | 218 | 1769025 | 4503.33 | 1562 | 1532 | 392.5 |
| D | 12 | 79 | 558491 | 1419.05 | 1562 | 1532 | 392.5 |
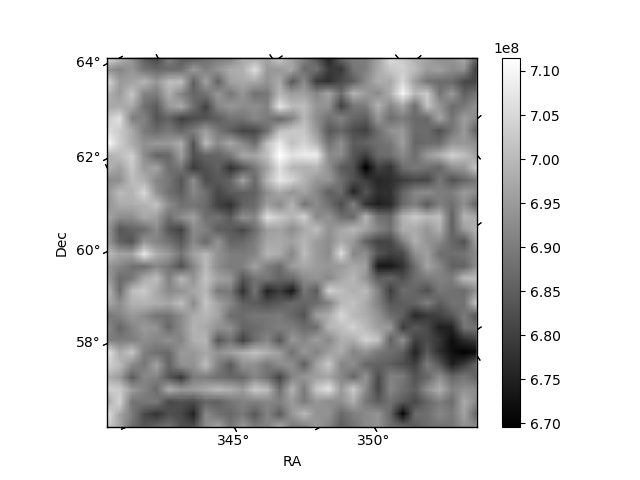
Histogram calculated using DETX and DETY for each event in the final _common_clean file
| Quadrant A |  |
 |
Quadrant B |
|---|---|---|---|
| Quadrant D | 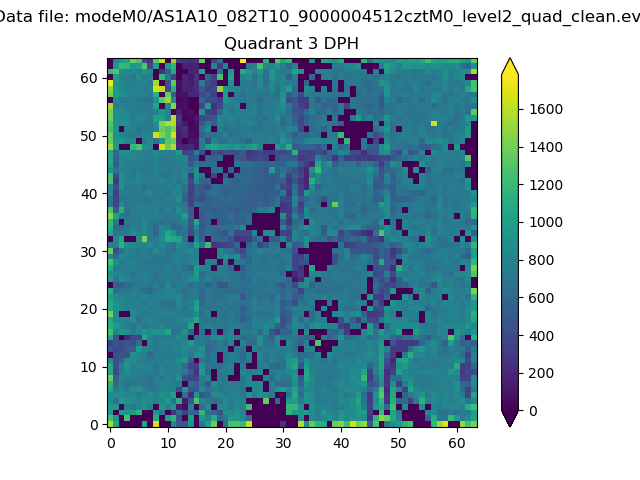 |
 |
Quadrant C |
| Plot type | Count rate plots | Images |
|---|---|---|
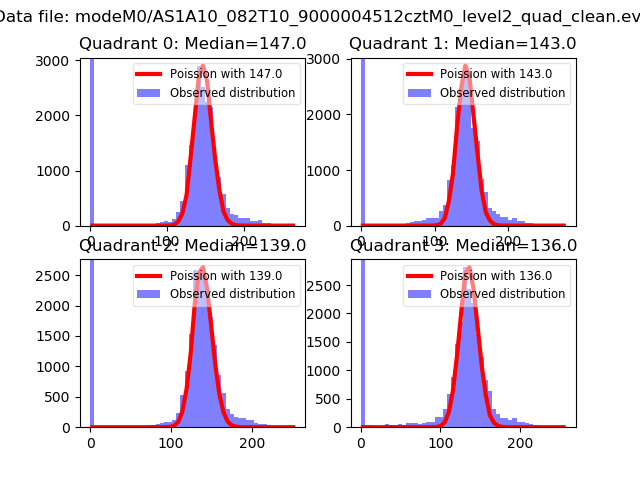
| Comparison with Poisson distribution Blue bars denote a histogram of data divided into 1 sec bins. Red curve is a Poisson curve with rate = median count rate of data. |
 |
 |
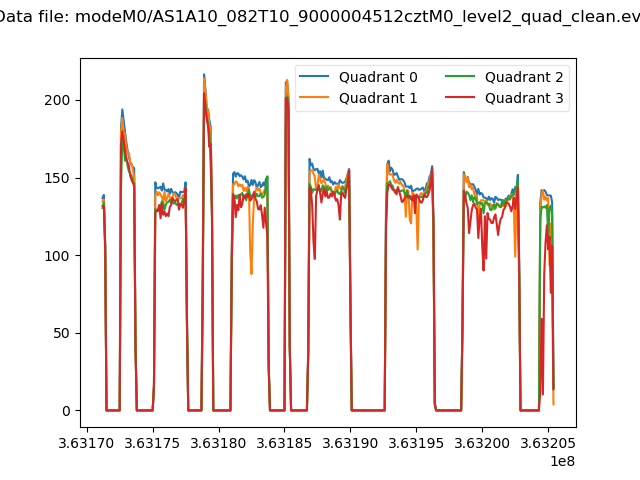
| Quadrant-wise count rates Data is divided into 100 sec bins |
 |
|
| Module-wise count rates for Quadrant A Data is divided into 100 sec bins |
 |
 |
| Module-wise count rates for Quadrant B Data is divided into 100 sec bins |
 |
 |
| Module-wise count rates for Quadrant C Data is divided into 100 sec bins |
 |
 |
| Module-wise count rates for Quadrant D Data is divided into 100 sec bins |
 |
 |
| Parameter | Plot |
|---|---|
| CZT HV Monitor | 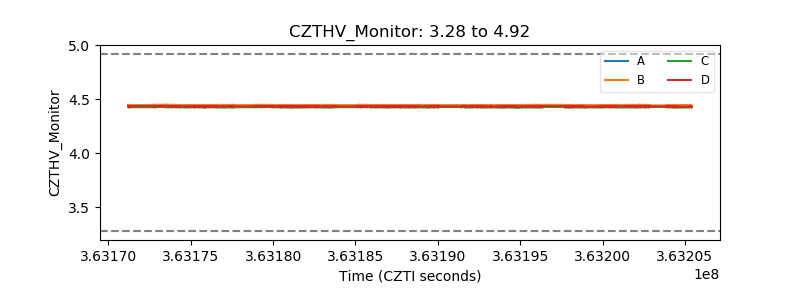 |
| D_VDD | 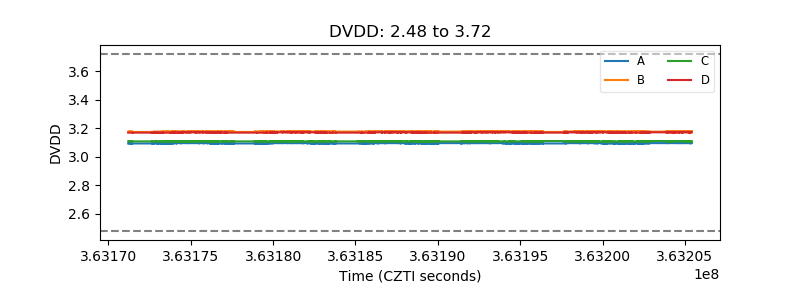 |
| Temperature 1 |  |
| Veto HV Monitor | 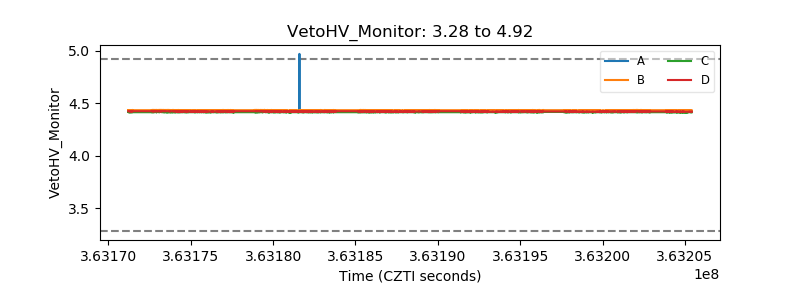 |
| Veto LLD |  |
| Alpha Counter |  |
| _CPM_Rate | 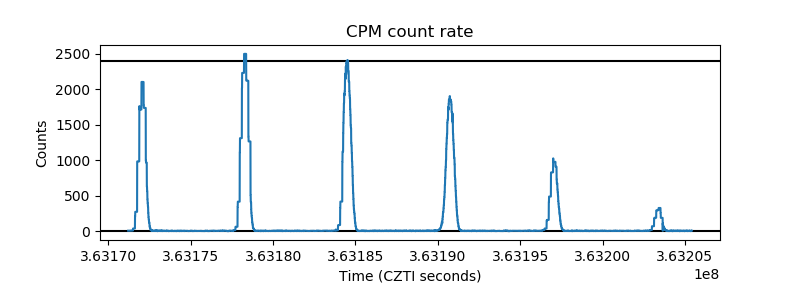 |
| CZT Counter |  |
| +2.5 Volts monitor | 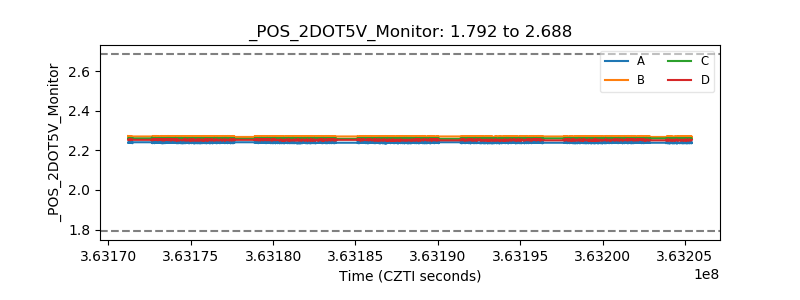 |
| +5 Volts monitor | 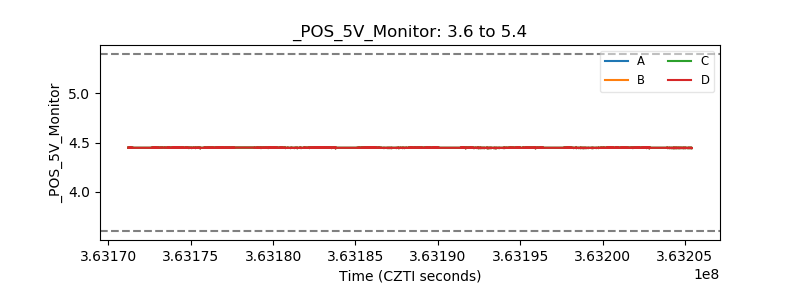 |
| _ROLL_ROT |  |
| _Roll_DEC | 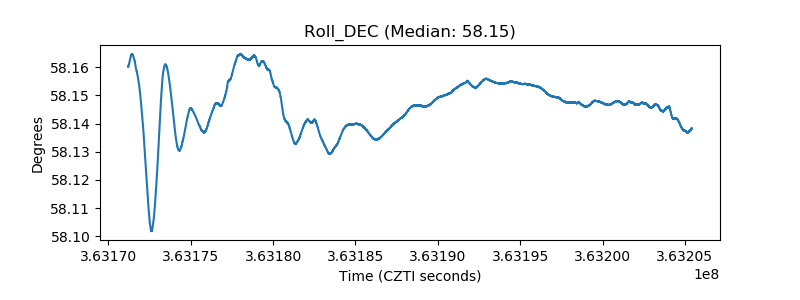 |
| _Roll_RA | 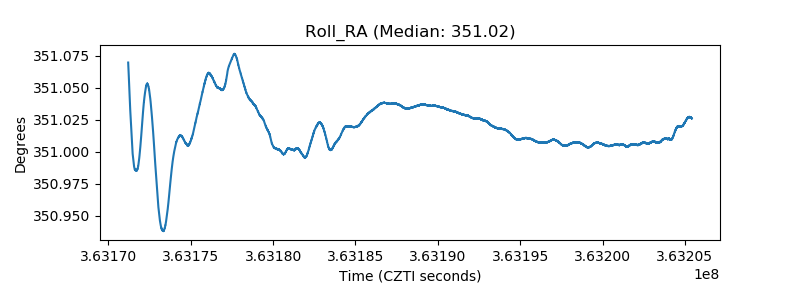 |
| Veto Counter |  |