| Param | Original file | Final file |
|---|---|---|
| Filename | modeM0/AS1C06_010T01_9000004504cztM0_level2_bc.evt | modeM0/AS1C06_010T01_9000004504cztM0_level2_quad_clean.evt |
| Size (bytes) | 880,433,280 | 282,867,840 |
| Size | 839.6 MB | 269.8 MB |
| Events in quadrant A | 3,101,470 | 1,961,641 |
| Events in quadrant B | 7,683,714 | 1,914,985 |
| Events in quadrant C | 3,158,229 | 1,866,342 |
| Events in quadrant D | 11,695,870 | 1,788,485 |
| Mode M9 | |||
|---|---|---|---|
| Quadrant | BADHDUFLAG | Total packets | Discarded packets |
| A | 0 | 25 | 0 |
| B | 0 | 25 | 0 |
| C | 0 | 25 | 0 |
| D | 0 | 25 | 0 |
| Mode SS | |||
|---|---|---|---|
| Quadrant | BADHDUFLAG | Total packets | Discarded packets |
| A | 0 | 306 | 0 |
| B | 0 | 306 | 0 |
| C | 0 | 306 | 0 |
| D | 0 | 306 | 0 |
| Mode M0 | |||
|---|---|---|---|
| Quadrant | BADHDUFLAG | Total packets | Discarded packets |
| A | 0 | 30511 | 0 |
| B | 0 | 47032 | 0 |
| C | 0 | 31037 | 0 |
| D | 0 | 58438 | 0 |
| Quadrant | Total seconds | Saturated seconds | Saturation percentage |
|---|---|---|---|
| A | 15020 | 65 | 0.432756% |
| B | 15020 | 350 | 2.330226% |
| C | 15020 | 150 | 0.998668% |
| D | 15020 | 1203 | 8.009321% |
Noise dominated data is calculated using 1-second bins in cleaned event files. If a bin has >2000 counts, and if more than 50% of those come from <1% of pixels, then it is considered to be noise-dominated and hence unusable.
| Quadrant | # 1 sec bins | Bins with >0 counts | Bins with >2000 counts | High rate bins dominated by noise | Noise dominated (total time) | Noise dominated (detector-on time) | Marked lightcurve |
|---|---|---|---|---|---|---|---|
| A | 16864 | 15019 | 1 | 1 | 0.01% | 0.01% |  |
| B | 16864 | 15020 | 1 | 1 | 0.01% | 0.01% |  |
| C | 16864 | 15020 | 11 | 11 | 0.07% | 0.07% | 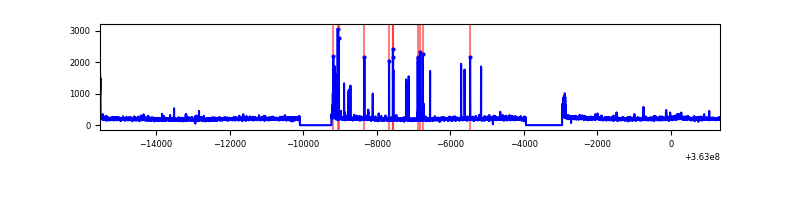 |
| D | 16864 | 15019 | 343 | 343 | 2.03% | 2.28% |  |
Top three noisy pixels from each quadrant. If the there are fewer than three noisy pixels in the level2.evt file, extra rows are filled as -1
| Pixel properties | Quadrant properties | ||||||
|---|---|---|---|---|---|---|---|
| Quadrant | DetID | PixID | Counts | Sigma | Mean | Median | Sigma |
| A | 15 | 174 | 27718 | 156.4 | 786 | 773 | 172.3 |
| A | 13 | 254 | 25998 | 146.42 | 786 | 773 | 172.3 |
| A | 11 | 47 | 22362 | 125.31 | 786 | 773 | 172.3 |
| B | 6 | 159 | 4071489 | 26925.51 | 774 | 754 | 151.2 |
| B | 12 | 18 | 239854 | 1581.51 | 774 | 754 | 151.2 |
| B | 15 | 33 | 129231 | 849.8 | 774 | 754 | 151.2 |
| C | 0 | 10 | 189568 | 1044.99 | 744 | 740 | 180.7 |
| C | 3 | 233 | 30914 | 166.99 | 744 | 740 | 180.7 |
| C | 2 | 114 | 28578 | 154.06 | 744 | 740 | 180.7 |
| D | 8 | 195 | 6418914 | 33276.03 | 746 | 726 | 192.9 |
| D | 13 | 174 | 1761191 | 9127.39 | 746 | 726 | 192.9 |
| D | 12 | 233 | 258229 | 1335.06 | 746 | 726 | 192.9 |
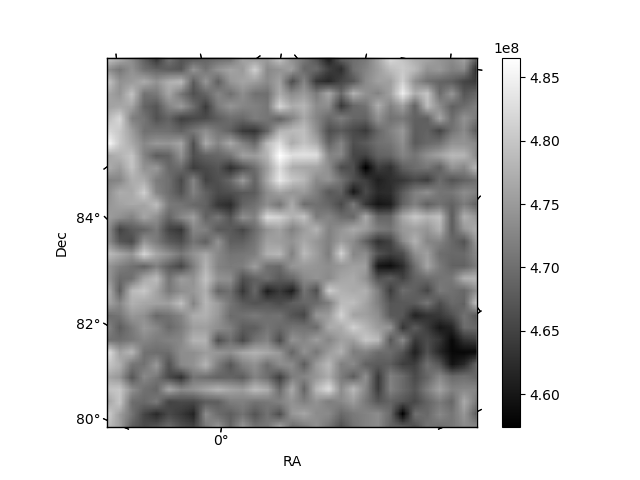
Histogram calculated using DETX and DETY for each event in the final _common_clean file
| Quadrant A |  |
 |
Quadrant B |
|---|---|---|---|
| Quadrant D |  |
 |
Quadrant C |
| Plot type | Count rate plots | Images |
|---|---|---|
| Comparison with Poisson distribution Blue bars denote a histogram of data divided into 1 sec bins. Red curve is a Poisson curve with rate = median count rate of data. |
 |
 |
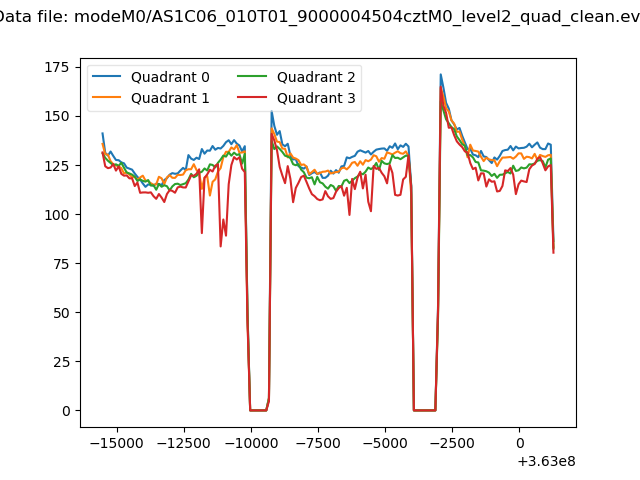
| Quadrant-wise count rates Data is divided into 100 sec bins |
 |
|
| Module-wise count rates for Quadrant A Data is divided into 100 sec bins |
 |
 |
| Module-wise count rates for Quadrant B Data is divided into 100 sec bins |
 |
 |
| Module-wise count rates for Quadrant C Data is divided into 100 sec bins |
 |
 |
| Module-wise count rates for Quadrant D Data is divided into 100 sec bins |
 |
 |
| Parameter | Plot |
|---|---|
| CZT HV Monitor |  |
| D_VDD | 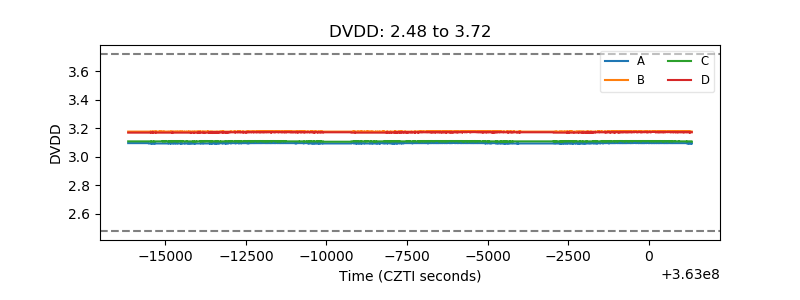 |
| Temperature 1 |  |
| Veto HV Monitor |  |
| Veto LLD |  |
| Alpha Counter |  |
| _CPM_Rate |  |
| CZT Counter |  |
| +2.5 Volts monitor |  |
| +5 Volts monitor | 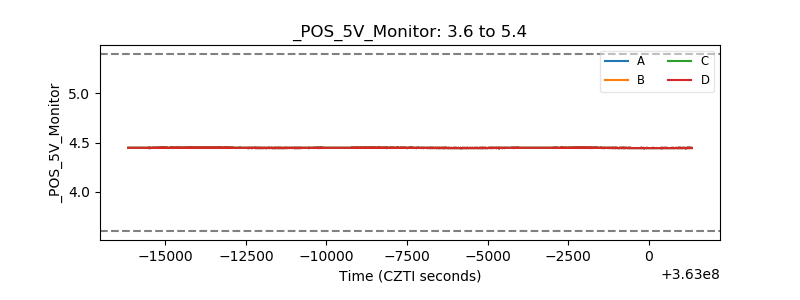 |
| _ROLL_ROT |  |
| _Roll_DEC |  |
| _Roll_RA | 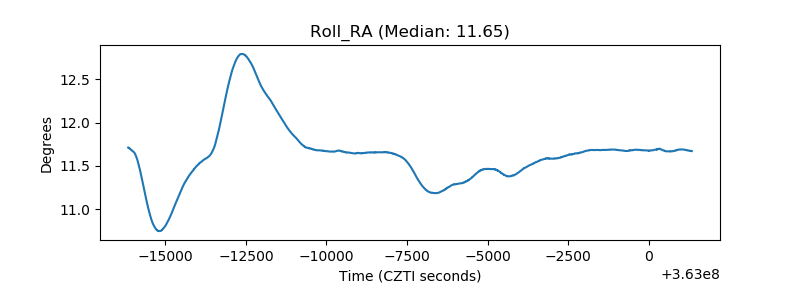 |
| Veto Counter |  |