| Param | Original file | Final file |
|---|---|---|
| Filename | modeM0/AS1C06_006T05_9000004506cztM0_level2_bc.evt | modeM0/AS1C06_006T05_9000004506cztM0_level2_quad_clean.evt |
| Size (bytes) | 409,602,240 | 132,212,160 |
| Size | 390.6 MB | 126.1 MB |
| Events in quadrant A | 1,822,568 | 908,389 |
| Events in quadrant B | 3,989,689 | 887,828 |
| Events in quadrant C | 1,909,476 | 851,216 |
| Events in quadrant D | 4,166,636 | 835,287 |
| Mode M0 | |||
|---|---|---|---|
| Quadrant | BADHDUFLAG | Total packets | Discarded packets |
| A | 0 | 16683 | 0 |
| B | 0 | 23571 | 0 |
| C | 0 | 17071 | 0 |
| D | 0 | 24645 | 0 |
| Mode M9 | |||
|---|---|---|---|
| Quadrant | BADHDUFLAG | Total packets | Discarded packets |
| A | 0 | 23 | 0 |
| B | 0 | 23 | 0 |
| C | 0 | 23 | 0 |
| D | 0 | 23 | 0 |
| Mode SS | |||
|---|---|---|---|
| Quadrant | BADHDUFLAG | Total packets | Discarded packets |
| A | 0 | 154 | 0 |
| B | 0 | 154 | 0 |
| C | 0 | 154 | 0 |
| D | 0 | 154 | 0 |
| Quadrant | Total seconds | Saturated seconds | Saturation percentage |
|---|---|---|---|
| A | 7500 | 149 | 1.986667% |
| B | 7500 | 268 | 3.573333% |
| C | 7500 | 247 | 3.293333% |
| D | 7500 | 287 | 3.826667% |
Noise dominated data is calculated using 1-second bins in cleaned event files. If a bin has >2000 counts, and if more than 50% of those come from <1% of pixels, then it is considered to be noise-dominated and hence unusable.
| Quadrant | # 1 sec bins | Bins with >0 counts | Bins with >2000 counts | High rate bins dominated by noise | Noise dominated (total time) | Noise dominated (detector-on time) | Marked lightcurve |
|---|---|---|---|---|---|---|---|
| A | 9795 | 7500 | 0 | 0 | 0.00% | 0.00% |  |
| B | 9795 | 7501 | 0 | 0 | 0.00% | 0.00% |  |
| C | 9795 | 7500 | 1 | 1 | 0.01% | 0.01% |  |
| D | 9795 | 7501 | 29 | 29 | 0.30% | 0.39% |  |
Top three noisy pixels from each quadrant. If the there are fewer than three noisy pixels in the level2.evt file, extra rows are filled as -1
| Pixel properties | Quadrant properties | ||||||
|---|---|---|---|---|---|---|---|
| Quadrant | DetID | PixID | Counts | Sigma | Mean | Median | Sigma |
| A | 13 | 254 | 13536 | 127.73 | 471 | 464 | 102.3 |
| A | 11 | 47 | 3484 | 29.51 | 471 | 464 | 102.3 |
| A | 0 | 226 | 3175 | 26.49 | 471 | 464 | 102.3 |
| B | 6 | 159 | 2013271 | 22973.79 | 462 | 453 | 87.6 |
| B | 0 | 190 | 77791 | 882.72 | 462 | 453 | 87.6 |
| B | 12 | 18 | 25747 | 288.7 | 462 | 453 | 87.6 |
| C | 0 | 10 | 169114 | 1634.02 | 439 | 439 | 103.2 |
| C | 4 | 175 | 17848 | 168.65 | 439 | 439 | 103.2 |
| C | 2 | 114 | 14442 | 135.65 | 439 | 439 | 103.2 |
| D | 8 | 195 | 1996927 | 17118.08 | 452 | 441 | 116.6 |
| D | 12 | 233 | 139945 | 1196.12 | 452 | 441 | 116.6 |
| D | 13 | 249 | 95459 | 814.69 | 452 | 441 | 116.6 |
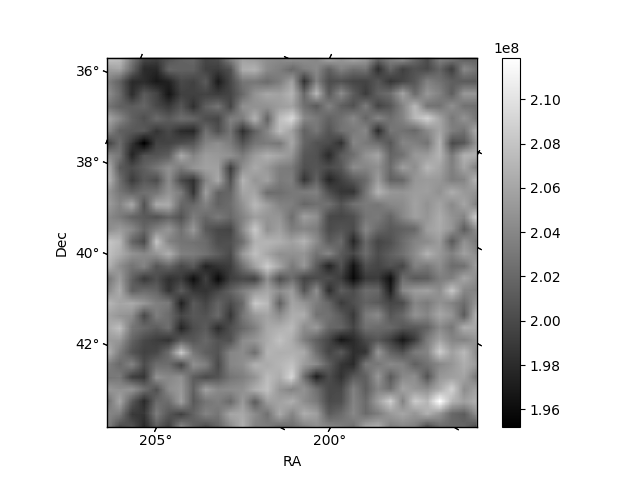
Histogram calculated using DETX and DETY for each event in the final _common_clean file
| Quadrant A |  |
 |
Quadrant B |
|---|---|---|---|
| Quadrant D |  |
 |
Quadrant C |
| Plot type | Count rate plots | Images |
|---|---|---|
| Comparison with Poisson distribution Blue bars denote a histogram of data divided into 1 sec bins. Red curve is a Poisson curve with rate = median count rate of data. |
 |
 |
| Quadrant-wise count rates Data is divided into 100 sec bins |
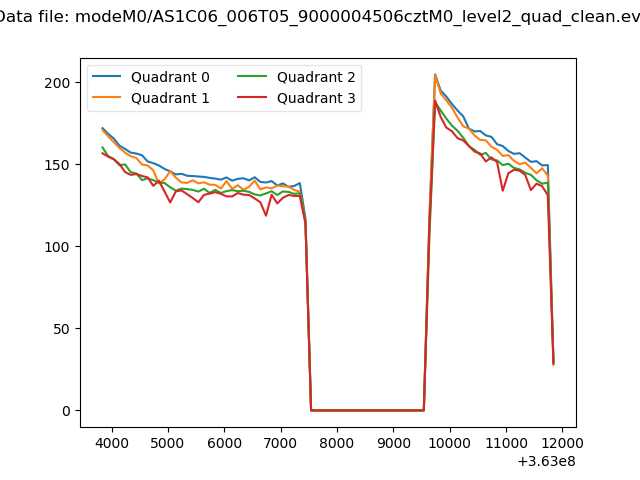 |
|
| Module-wise count rates for Quadrant A Data is divided into 100 sec bins |
 |
 |
| Module-wise count rates for Quadrant B Data is divided into 100 sec bins |
 |
 |
| Module-wise count rates for Quadrant C Data is divided into 100 sec bins |
 |
 |
| Module-wise count rates for Quadrant D Data is divided into 100 sec bins |
 |
 |
| Parameter | Plot |
|---|---|
| CZT HV Monitor |  |
| D_VDD |  |
| Temperature 1 |  |
| Veto HV Monitor |  |
| Veto LLD | 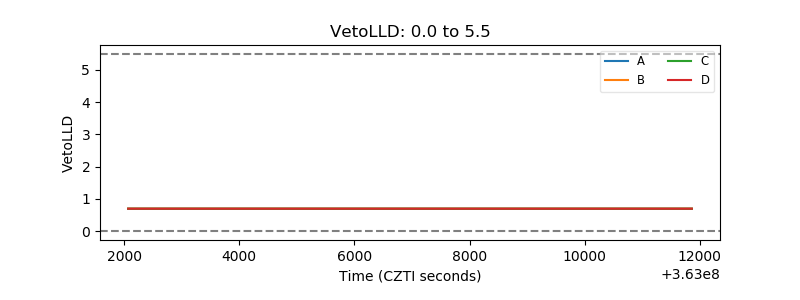 |
| Alpha Counter |  |
| _CPM_Rate |  |
| CZT Counter |  |
| +2.5 Volts monitor |  |
| +5 Volts monitor |  |
| _ROLL_ROT |  |
| _Roll_DEC |  |
| _Roll_RA |  |
| Veto Counter |  |