| Param | Original file | Final file |
|---|---|---|
| Filename | modeM0/AS1C06_001T01_9000004508cztM0_level2_bc.evt | modeM0/AS1C06_001T01_9000004508cztM0_level2_quad_clean.evt |
| Size (bytes) | 1,270,771,200 | 366,742,080 |
| Size | 1.2 GB | 349.8 MB |
| Events in quadrant A | 5,532,447 | 2,455,623 |
| Events in quadrant B | 12,061,074 | 2,445,356 |
| Events in quadrant C | 5,642,452 | 2,338,236 |
| Events in quadrant D | 13,664,891 | 2,268,097 |
| Mode SS | |||
|---|---|---|---|
| Quadrant | BADHDUFLAG | Total packets | Discarded packets |
| A | 0 | 476 | 0 |
| B | 0 | 476 | 0 |
| C | 0 | 476 | 0 |
| D | 0 | 476 | 0 |
| Mode M9 | |||
|---|---|---|---|
| Quadrant | BADHDUFLAG | Total packets | Discarded packets |
| A | 0 | 56 | 0 |
| B | 0 | 56 | 0 |
| C | 0 | 56 | 0 |
| D | 0 | 56 | 0 |
| Mode M0 | |||
|---|---|---|---|
| Quadrant | BADHDUFLAG | Total packets | Discarded packets |
| A | 0 | 50671 | 0 |
| B | 0 | 71718 | 0 |
| C | 0 | 52309 | 0 |
| D | 0 | 76919 | 0 |
| Quadrant | Total seconds | Saturated seconds | Saturation percentage |
|---|---|---|---|
| A | 23269 | 317 | 1.362328% |
| B | 23269 | 651 | 2.797714% |
| C | 23269 | 748 | 3.214577% |
| D | 23269 | 1109 | 4.765998% |
Noise dominated data is calculated using 1-second bins in cleaned event files. If a bin has >2000 counts, and if more than 50% of those come from <1% of pixels, then it is considered to be noise-dominated and hence unusable.
| Quadrant | # 1 sec bins | Bins with >0 counts | Bins with >2000 counts | High rate bins dominated by noise | Noise dominated (total time) | Noise dominated (detector-on time) | Marked lightcurve |
|---|---|---|---|---|---|---|---|
| A | 28889 | 23269 | 0 | 0 | 0.00% | 0.00% |  |
| B | 28889 | 23269 | 0 | 0 | 0.00% | 0.00% |  |
| C | 28889 | 23270 | 6 | 6 | 0.02% | 0.03% |  |
| D | 28889 | 23269 | 84 | 84 | 0.29% | 0.36% |  |
Top three noisy pixels from each quadrant. If the there are fewer than three noisy pixels in the level2.evt file, extra rows are filled as -1
| Pixel properties | Quadrant properties | ||||||
|---|---|---|---|---|---|---|---|
| Quadrant | DetID | PixID | Counts | Sigma | Mean | Median | Sigma |
| A | 11 | 47 | 51146 | 165.25 | 1412 | 1391 | 301.1 |
| A | 13 | 254 | 37640 | 120.39 | 1412 | 1391 | 301.1 |
| A | 12 | 96 | 22611 | 70.48 | 1412 | 1391 | 301.1 |
| B | 6 | 159 | 6422087 | 24058.58 | 1414 | 1383 | 266.9 |
| B | 0 | 190 | 106946 | 395.55 | 1414 | 1383 | 266.9 |
| B | 15 | 33 | 69293 | 254.46 | 1414 | 1383 | 266.9 |
| C | 0 | 10 | 230387 | 731.78 | 1347 | 1345 | 313.0 |
| C | 3 | 233 | 59059 | 184.39 | 1347 | 1345 | 313.0 |
| C | 2 | 114 | 43137 | 133.52 | 1347 | 1345 | 313.0 |
| D | 8 | 195 | 5374880 | 16173.25 | 1358 | 1324 | 332.2 |
| D | 12 | 79 | 2405769 | 7236.86 | 1358 | 1324 | 332.2 |
| D | 13 | 174 | 223619 | 669.06 | 1358 | 1324 | 332.2 |
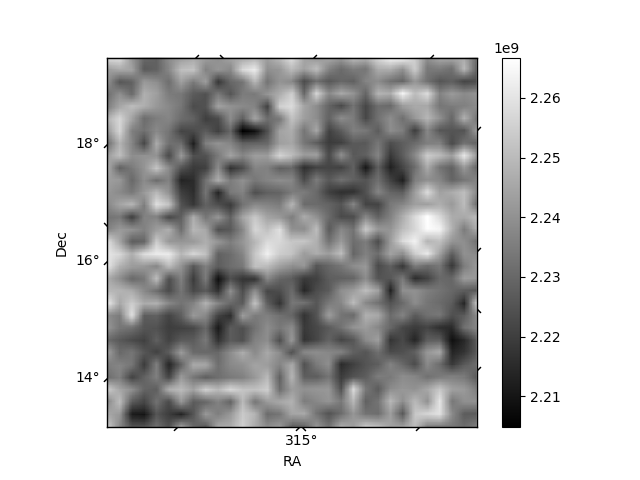
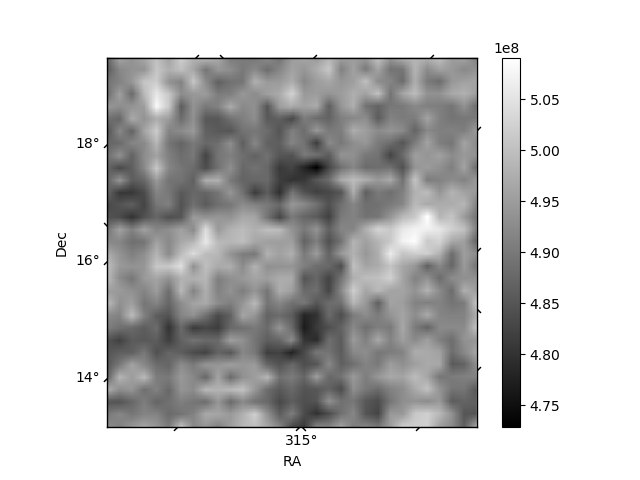
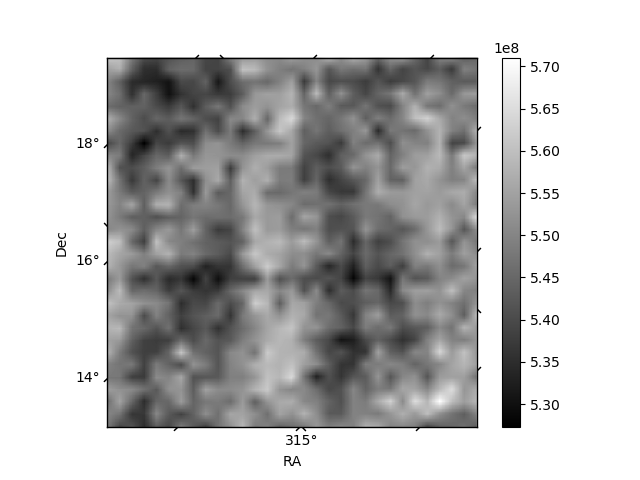
Histogram calculated using DETX and DETY for each event in the final _common_clean file
| Quadrant A | 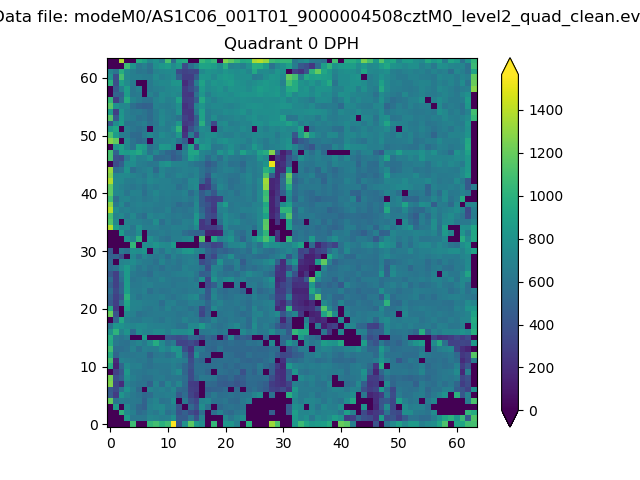 |
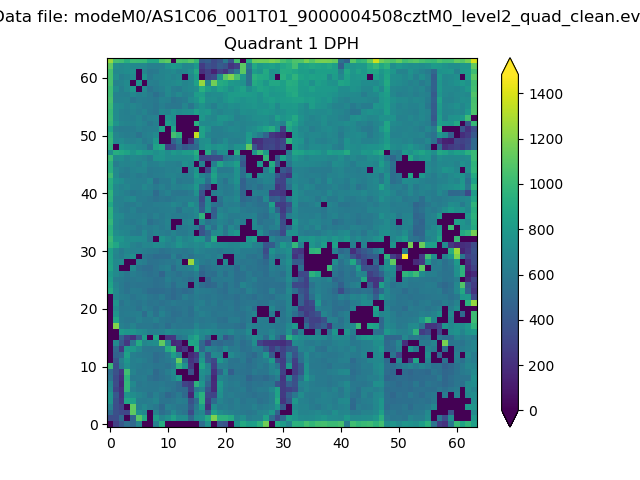 |
Quadrant B |
|---|---|---|---|
| Quadrant D |  |
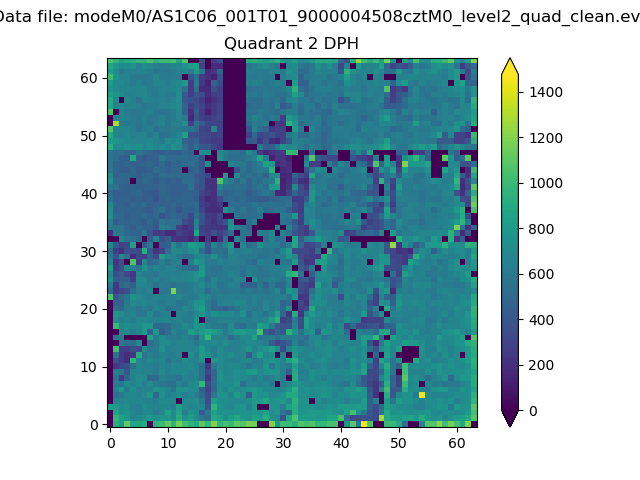 |
Quadrant C |
| Plot type | Count rate plots | Images |
|---|---|---|
| Comparison with Poisson distribution Blue bars denote a histogram of data divided into 1 sec bins. Red curve is a Poisson curve with rate = median count rate of data. |
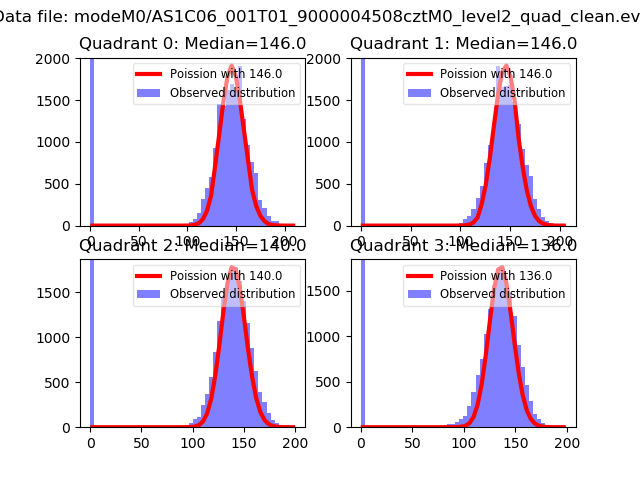 |
 |
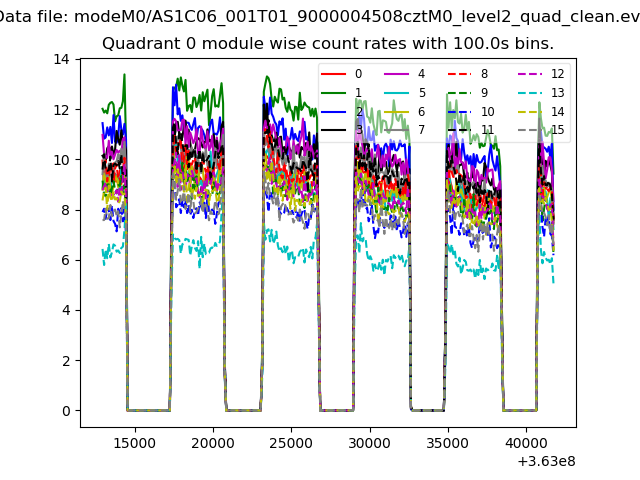
| Quadrant-wise count rates Data is divided into 100 sec bins |
 |
|
| Module-wise count rates for Quadrant A Data is divided into 100 sec bins |
 |
 |
| Module-wise count rates for Quadrant B Data is divided into 100 sec bins |
 |
 |
| Module-wise count rates for Quadrant C Data is divided into 100 sec bins |
 |
 |
| Module-wise count rates for Quadrant D Data is divided into 100 sec bins |
 |
 |
| Parameter | Plot |
|---|---|
| CZT HV Monitor |  |
| D_VDD |  |
| Temperature 1 |  |
| Veto HV Monitor | 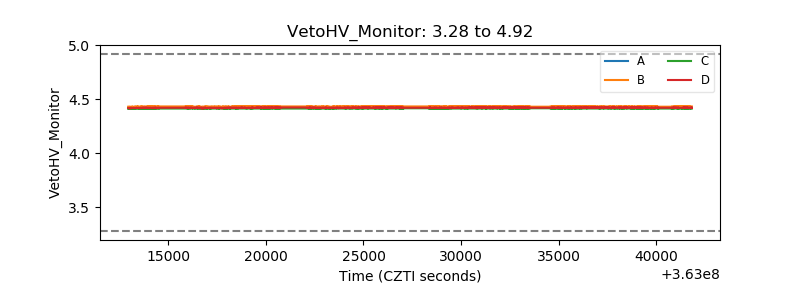 |
| Veto LLD |  |
| Alpha Counter |  |
| _CPM_Rate |  |
| CZT Counter |  |
| +2.5 Volts monitor | 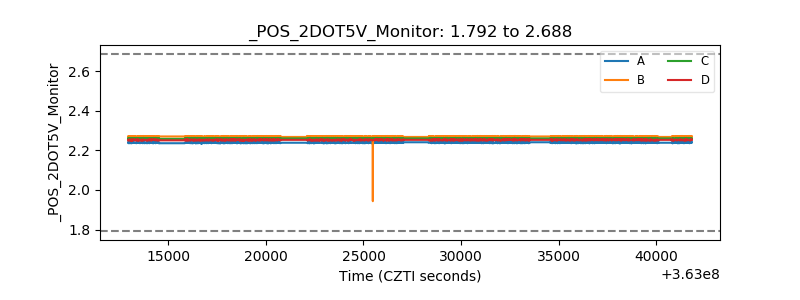 |
| +5 Volts monitor |  |
| _ROLL_ROT | 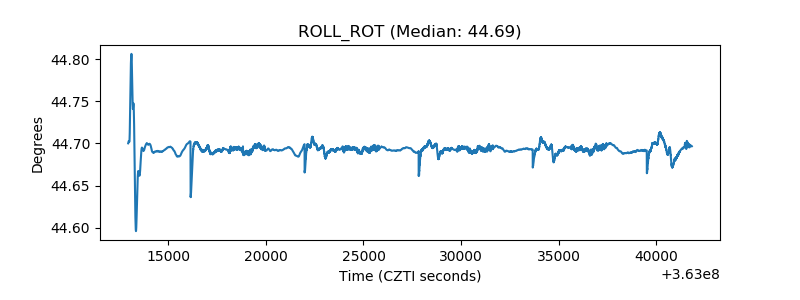 |
| _Roll_DEC |  |
| _Roll_RA |  |
| Veto Counter | 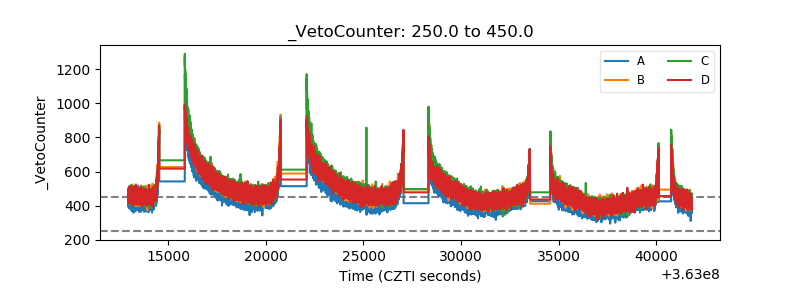 |