| Param | Original file | Final file |
|---|---|---|
| Filename | modeM0/AS1A10_058T02_9000004510cztM0_level2_bc.evt | modeM0/AS1A10_058T02_9000004510cztM0_level2_quad_clean.evt |
| Size (bytes) | 5,895,167,040 | 1,423,048,320 |
| Size | 5.5 GB | 1.3 GB |
| Events in quadrant A | 24,330,641 | 9,129,303 |
| Events in quadrant B | 57,583,450 | 8,990,255 |
| Events in quadrant C | 25,230,629 | 8,718,345 |
| Events in quadrant D | 63,764,912 | 8,560,201 |
| Mode M0 | |||
|---|---|---|---|
| Quadrant | BADHDUFLAG | Total packets | Discarded packets |
| A | 0 | 235998 | 0 |
| B | 0 | 356083 | 0 |
| C | 0 | 243891 | 0 |
| D | 0 | 363611 | 0 |
| Mode SS | |||
|---|---|---|---|
| Quadrant | BADHDUFLAG | Total packets | Discarded packets |
| A | 0 | 2292 | 0 |
| B | 0 | 2292 | 0 |
| C | 0 | 2292 | 0 |
| D | 0 | 2292 | 0 |
| Mode M9 | |||
|---|---|---|---|
| Quadrant | BADHDUFLAG | Total packets | Discarded packets |
| A | 0 | 158 | 0 |
| B | 0 | 158 | 0 |
| C | 0 | 158 | 0 |
| D | 0 | 158 | 0 |
| Quadrant | Total seconds | Saturated seconds | Saturation percentage |
|---|---|---|---|
| A | 112433 | 1058 | 0.941005% |
| B | 112433 | 4475 | 3.980148% |
| C | 112433 | 3011 | 2.678039% |
| D | 112433 | 3072 | 2.732294% |
Noise dominated data is calculated using 1-second bins in cleaned event files. If a bin has >2000 counts, and if more than 50% of those come from <1% of pixels, then it is considered to be noise-dominated and hence unusable.
| Quadrant | # 1 sec bins | Bins with >0 counts | Bins with >2000 counts | High rate bins dominated by noise | Noise dominated (total time) | Noise dominated (detector-on time) | Marked lightcurve |
|---|---|---|---|---|---|---|---|
| A | 128233 | 112438 | 9 | 9 | 0.01% | 0.01% |  |
| B | 128233 | 112434 | 52 | 52 | 0.04% | 0.05% |  |
| C | 128233 | 112438 | 19 | 19 | 0.01% | 0.02% |  |
| D | 128233 | 112434 | 176 | 176 | 0.14% | 0.16% |  |
Top three noisy pixels from each quadrant. If the there are fewer than three noisy pixels in the level2.evt file, extra rows are filled as -1
| Pixel properties | Quadrant properties | ||||||
|---|---|---|---|---|---|---|---|
| Quadrant | DetID | PixID | Counts | Sigma | Mean | Median | Sigma |
| A | 12 | 96 | 338599 | 250.06 | 6211 | 6108 | 1329.7 |
| A | 13 | 254 | 190660 | 138.8 | 6211 | 6108 | 1329.7 |
| A | 0 | 226 | 38433 | 24.31 | 6211 | 6108 | 1329.7 |
| B | 6 | 159 | 29425626 | 25601.24 | 6135 | 6000 | 1149.1 |
| B | 4 | 80 | 3040266 | 2640.45 | 6135 | 6000 | 1149.1 |
| B | 0 | 190 | 485761 | 417.49 | 6135 | 6000 | 1149.1 |
| C | 0 | 10 | 1428136 | 1027.98 | 5888 | 5872 | 1383.5 |
| C | 10 | 22 | 558553 | 399.47 | 5888 | 5872 | 1383.5 |
| C | 2 | 114 | 206757 | 145.2 | 5888 | 5872 | 1383.5 |
| D | 8 | 195 | 37152252 | 24406.65 | 5977 | 5833 | 1522.0 |
| D | 12 | 79 | 1259169 | 823.49 | 5977 | 5833 | 1522.0 |
| D | 2 | 250 | 715871 | 466.52 | 5977 | 5833 | 1522.0 |
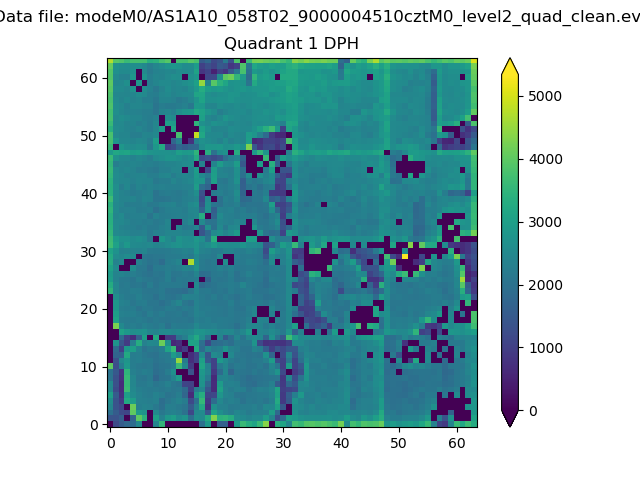
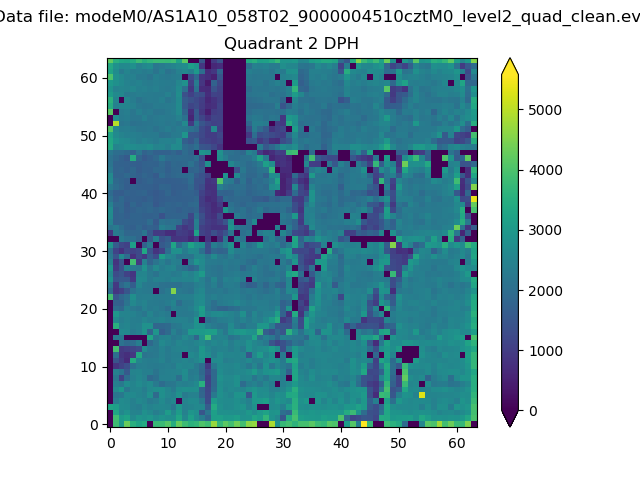
Histogram calculated using DETX and DETY for each event in the final _common_clean file
| Quadrant A |  |
 |
Quadrant B |
|---|---|---|---|
| Quadrant D | 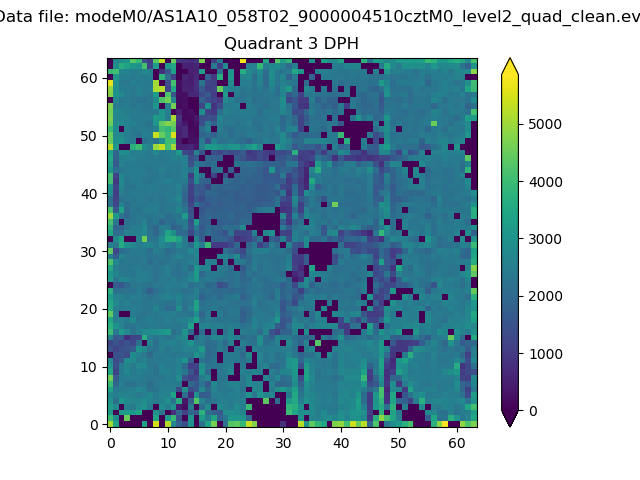 |
 |
Quadrant C |
| Plot type | Count rate plots | Images |
|---|---|---|
| Comparison with Poisson distribution Blue bars denote a histogram of data divided into 1 sec bins. Red curve is a Poisson curve with rate = median count rate of data. |
 |
 |
| Quadrant-wise count rates Data is divided into 100 sec bins |
 |
|
| Module-wise count rates for Quadrant A Data is divided into 100 sec bins |
 |
 |
| Module-wise count rates for Quadrant B Data is divided into 100 sec bins |
 |
 |
| Module-wise count rates for Quadrant C Data is divided into 100 sec bins |
 |
 |
| Module-wise count rates for Quadrant D Data is divided into 100 sec bins |
 |
 |
| Parameter | Plot |
|---|---|
| CZT HV Monitor | 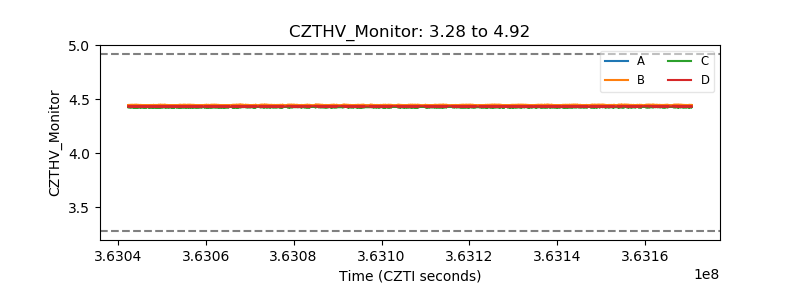 |
| D_VDD |  |
| Temperature 1 |  |
| Veto HV Monitor |  |
| Veto LLD |  |
| Alpha Counter |  |
| _CPM_Rate |  |
| CZT Counter | 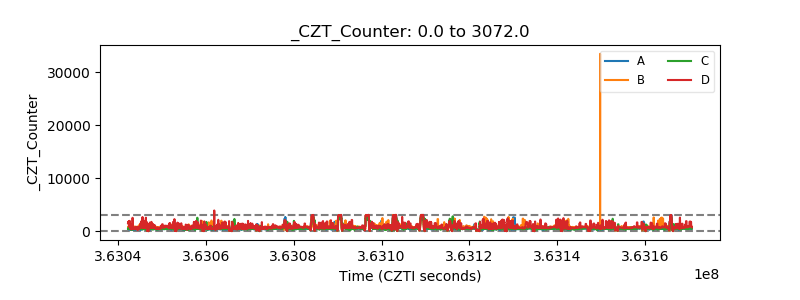 |
| +2.5 Volts monitor |  |
| +5 Volts monitor |  |
| _ROLL_ROT | 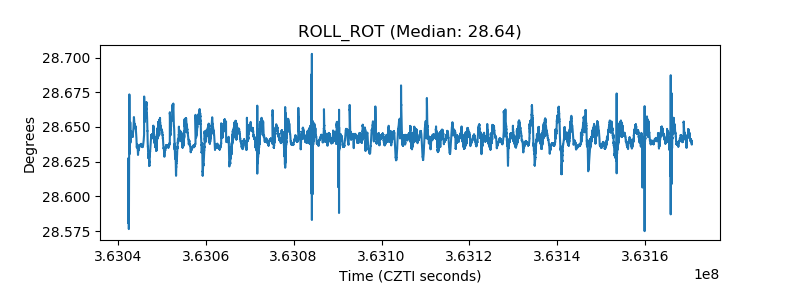 |
| _Roll_DEC | 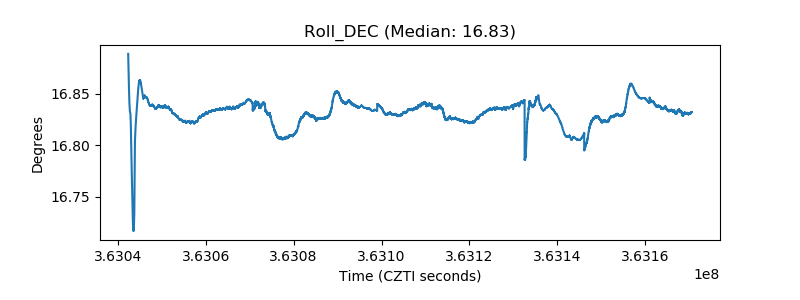 |
| _Roll_RA |  |
| Veto Counter |  |