| Param | Original file | Final file |
|---|---|---|
| Filename | modeM0/AS1C06_002T01_9000004500cztM0_level2_bc.evt | modeM0/AS1C06_002T01_9000004500cztM0_level2_quad_clean.evt |
| Size (bytes) | 2,965,818,240 | 832,610,880 |
| Size | 2.8 GB | 794.0 MB |
| Events in quadrant A | 11,116,017 | 5,722,636 |
| Events in quadrant B | 26,441,274 | 5,573,057 |
| Events in quadrant C | 12,327,110 | 5,485,501 |
| Events in quadrant D | 36,585,893 | 5,050,873 |
| Mode M0 | |||
|---|---|---|---|
| Quadrant | BADHDUFLAG | Total packets | Discarded packets |
| A | 0 | 104208 | 0 |
| B | 0 | 155581 | 0 |
| C | 0 | 110640 | 0 |
| D | 0 | 195859 | 0 |
| Mode SS | |||
|---|---|---|---|
| Quadrant | BADHDUFLAG | Total packets | Discarded packets |
| A | 0 | 1006 | 0 |
| B | 0 | 1006 | 0 |
| C | 0 | 1006 | 0 |
| D | 0 | 1006 | 0 |
| Mode M9 | |||
|---|---|---|---|
| Quadrant | BADHDUFLAG | Total packets | Discarded packets |
| A | 0 | 88 | 0 |
| B | 0 | 88 | 0 |
| C | 0 | 88 | 0 |
| D | 0 | 88 | 0 |
| Quadrant | Total seconds | Saturated seconds | Saturation percentage |
|---|---|---|---|
| A | 49353 | 508 | 1.029319% |
| B | 49353 | 1320 | 2.674609% |
| C | 49353 | 1530 | 3.100115% |
| D | 49353 | 6074 | 12.307256% |
Noise dominated data is calculated using 1-second bins in cleaned event files. If a bin has >2000 counts, and if more than 50% of those come from <1% of pixels, then it is considered to be noise-dominated and hence unusable.
| Quadrant | # 1 sec bins | Bins with >0 counts | Bins with >2000 counts | High rate bins dominated by noise | Noise dominated (total time) | Noise dominated (detector-on time) | Marked lightcurve |
|---|---|---|---|---|---|---|---|
| A | 58188 | 49353 | 14 | 14 | 0.02% | 0.03% |  |
| B | 58188 | 49353 | 28 | 28 | 0.05% | 0.06% |  |
| C | 58188 | 49354 | 10 | 10 | 0.02% | 0.02% |  |
| D | 58188 | 49355 | 737 | 737 | 1.27% | 1.49% | 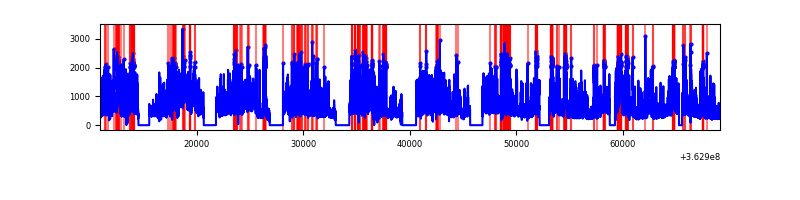 |
Top three noisy pixels from each quadrant. If the there are fewer than three noisy pixels in the level2.evt file, extra rows are filled as -1
| Pixel properties | Quadrant properties | ||||||
|---|---|---|---|---|---|---|---|
| Quadrant | DetID | PixID | Counts | Sigma | Mean | Median | Sigma |
| A | 3 | 247 | 159756 | 261.93 | 2790 | 2753 | 599.4 |
| A | 12 | 96 | 133617 | 218.32 | 2790 | 2753 | 599.4 |
| A | 13 | 254 | 95590 | 154.88 | 2790 | 2753 | 599.4 |
| B | 6 | 159 | 14106300 | 27413.21 | 2751 | 2701 | 514.5 |
| B | 0 | 190 | 530791 | 1026.45 | 2751 | 2701 | 514.5 |
| B | 0 | 183 | 207271 | 397.62 | 2751 | 2701 | 514.5 |
| C | 3 | 233 | 956385 | 1497.72 | 2676 | 2675 | 636.8 |
| C | 0 | 10 | 451688 | 705.14 | 2676 | 2675 | 636.8 |
| C | 1 | 16 | 238922 | 371.0 | 2676 | 2675 | 636.8 |
| D | 8 | 195 | 18541658 | 27881.58 | 2605 | 2555 | 664.9 |
| D | 13 | 174 | 4104697 | 6169.35 | 2605 | 2555 | 664.9 |
| D | 2 | 250 | 1892305 | 2842.06 | 2605 | 2555 | 664.9 |
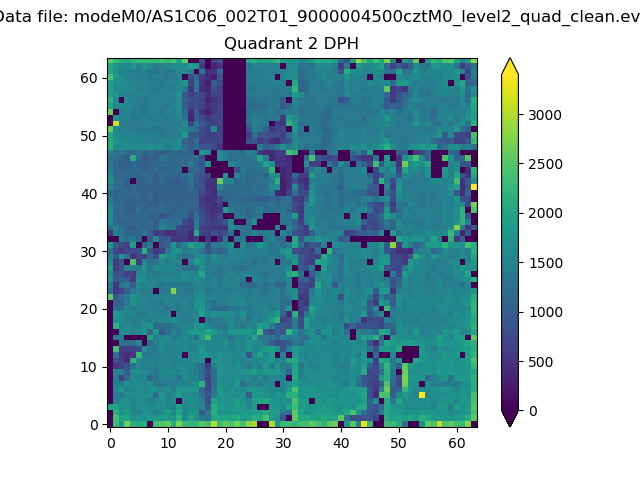
Histogram calculated using DETX and DETY for each event in the final _common_clean file
| Quadrant A | 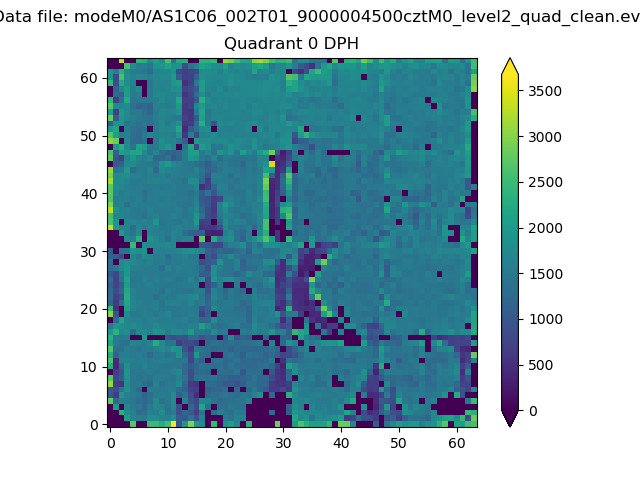 |
 |
Quadrant B |
|---|---|---|---|
| Quadrant D |  |
 |
Quadrant C |
| Plot type | Count rate plots | Images |
|---|---|---|
| Comparison with Poisson distribution Blue bars denote a histogram of data divided into 1 sec bins. Red curve is a Poisson curve with rate = median count rate of data. |
 |
 |
| Quadrant-wise count rates Data is divided into 100 sec bins |
 |
|
| Module-wise count rates for Quadrant A Data is divided into 100 sec bins |
 |
 |
| Module-wise count rates for Quadrant B Data is divided into 100 sec bins |
 |
 |
| Module-wise count rates for Quadrant C Data is divided into 100 sec bins |
 |
 |
| Module-wise count rates for Quadrant D Data is divided into 100 sec bins |
 |
 |
| Parameter | Plot |
|---|---|
| CZT HV Monitor | 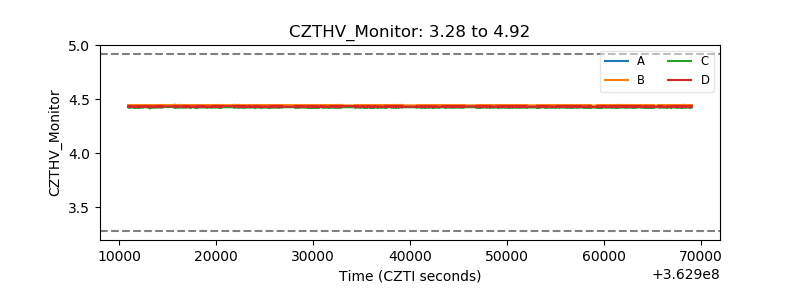 |
| D_VDD | 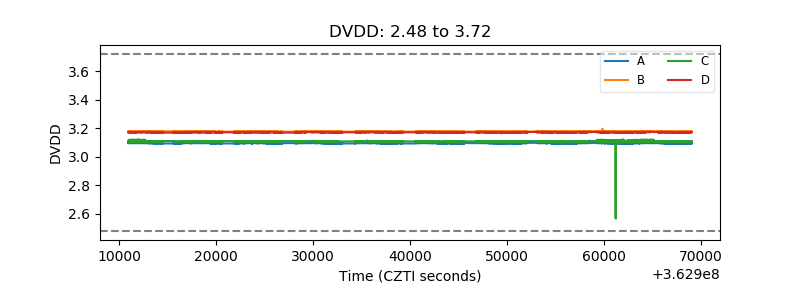 |
| Temperature 1 |  |
| Veto HV Monitor | 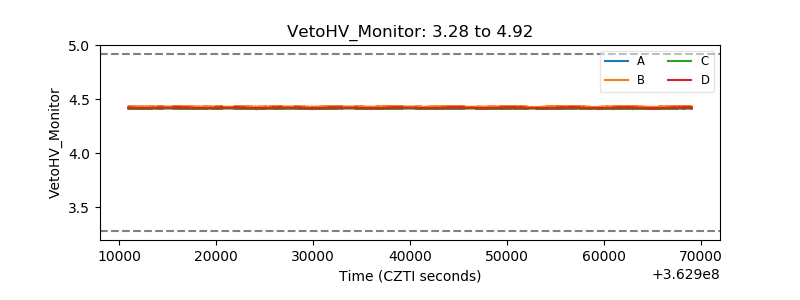 |
| Veto LLD |  |
| Alpha Counter |  |
| _CPM_Rate |  |
| CZT Counter |  |
| +2.5 Volts monitor | 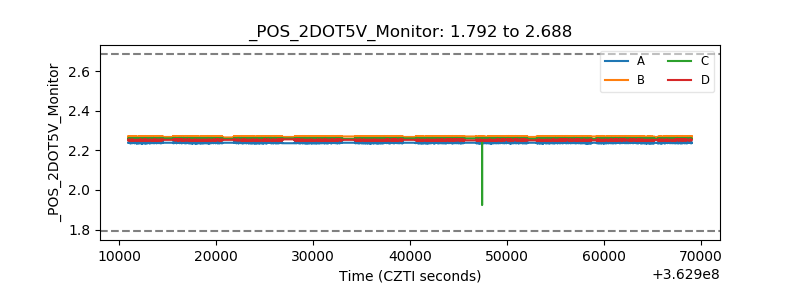 |
| +5 Volts monitor | 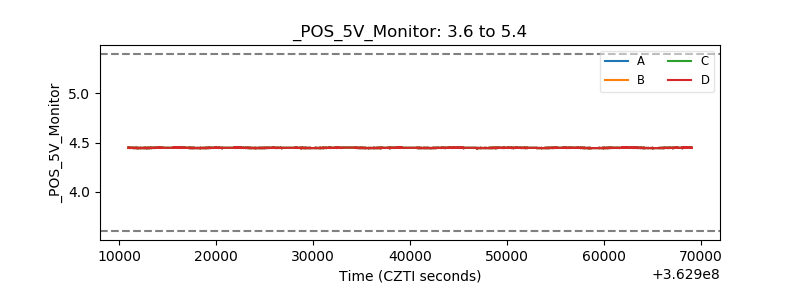 |
| _ROLL_ROT | 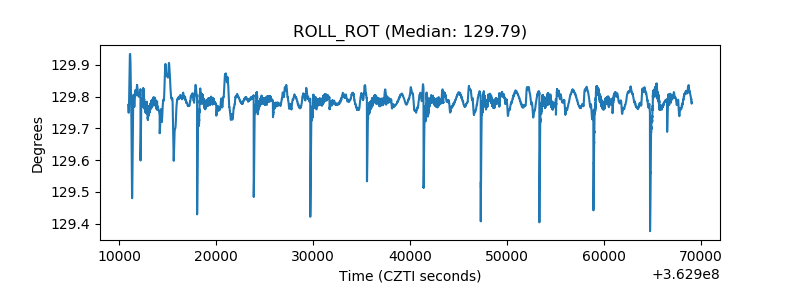 |
| _Roll_DEC |  |
| _Roll_RA |  |
| Veto Counter |  |