| Param | Original file | Final file |
|---|---|---|
| Filename | modeM0/AS1T04_018T01_9000004494cztM0_level2_bc.evt | modeM0/AS1T04_018T01_9000004494cztM0_level2_quad_clean.evt |
| Size (bytes) | 1,561,573,440 | 486,869,760 |
| Size | 1.5 GB | 464.3 MB |
| Events in quadrant A | 7,209,680 | 3,171,407 |
| Events in quadrant B | 17,140,782 | 3,121,515 |
| Events in quadrant C | 7,715,916 | 3,062,318 |
| Events in quadrant D | 12,858,741 | 3,003,871 |
| Mode M0 | |||
|---|---|---|---|
| Quadrant | BADHDUFLAG | Total packets | Discarded packets |
| A | 0 | 71637 | 0 |
| B | 0 | 106614 | 0 |
| C | 0 | 74070 | 0 |
| D | 0 | 89454 | 0 |
| Mode M9 | |||
|---|---|---|---|
| Quadrant | BADHDUFLAG | Total packets | Discarded packets |
| A | 0 | 47 | 0 |
| B | 0 | 47 | 0 |
| C | 0 | 47 | 0 |
| D | 0 | 47 | 0 |
| Mode SS | |||
|---|---|---|---|
| Quadrant | BADHDUFLAG | Total packets | Discarded packets |
| A | 0 | 702 | 0 |
| B | 0 | 702 | 0 |
| C | 0 | 702 | 0 |
| D | 0 | 702 | 0 |
| Quadrant | Total seconds | Saturated seconds | Saturation percentage |
|---|---|---|---|
| A | 34783 | 292 | 0.839491% |
| B | 34783 | 662 | 1.903229% |
| C | 34783 | 782 | 2.248225% |
| D | 34783 | 564 | 1.621482% |
Noise dominated data is calculated using 1-second bins in cleaned event files. If a bin has >2000 counts, and if more than 50% of those come from <1% of pixels, then it is considered to be noise-dominated and hence unusable.
| Quadrant | # 1 sec bins | Bins with >0 counts | Bins with >2000 counts | High rate bins dominated by noise | Noise dominated (total time) | Noise dominated (detector-on time) | Marked lightcurve |
|---|---|---|---|---|---|---|---|
| A | 39218 | 34784 | 0 | 0 | 0.00% | 0.00% |  |
| B | 39218 | 34784 | 12 | 12 | 0.03% | 0.03% |  |
| C | 39218 | 34783 | 14 | 14 | 0.04% | 0.04% | 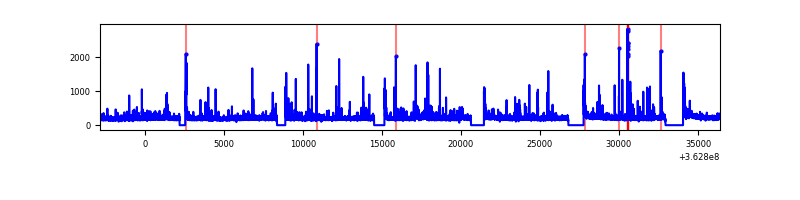 |
| D | 39218 | 34783 | 37 | 37 | 0.09% | 0.11% |  |
Top three noisy pixels from each quadrant. If the there are fewer than three noisy pixels in the level2.evt file, extra rows are filled as -1
| Pixel properties | Quadrant properties | ||||||
|---|---|---|---|---|---|---|---|
| Quadrant | DetID | PixID | Counts | Sigma | Mean | Median | Sigma |
| A | 13 | 254 | 60128 | 144.68 | 1858 | 1827 | 403.0 |
| A | 12 | 96 | 32573 | 76.3 | 1858 | 1827 | 403.0 |
| A | 0 | 226 | 11651 | 24.38 | 1858 | 1827 | 403.0 |
| B | 6 | 159 | 9206239 | 25984.98 | 1855 | 1813 | 354.2 |
| B | 0 | 190 | 193423 | 540.93 | 1855 | 1813 | 354.2 |
| B | 0 | 183 | 121225 | 337.11 | 1855 | 1813 | 354.2 |
| C | 0 | 10 | 529004 | 1259.4 | 1776 | 1772 | 418.6 |
| C | 14 | 225 | 84172 | 196.83 | 1776 | 1772 | 418.6 |
| C | 2 | 114 | 64264 | 149.27 | 1776 | 1772 | 418.6 |
| D | 8 | 195 | 4645187 | 10297.85 | 1805 | 1757 | 450.9 |
| D | 2 | 250 | 439545 | 970.89 | 1805 | 1757 | 450.9 |
| D | 13 | 174 | 303694 | 669.61 | 1805 | 1757 | 450.9 |
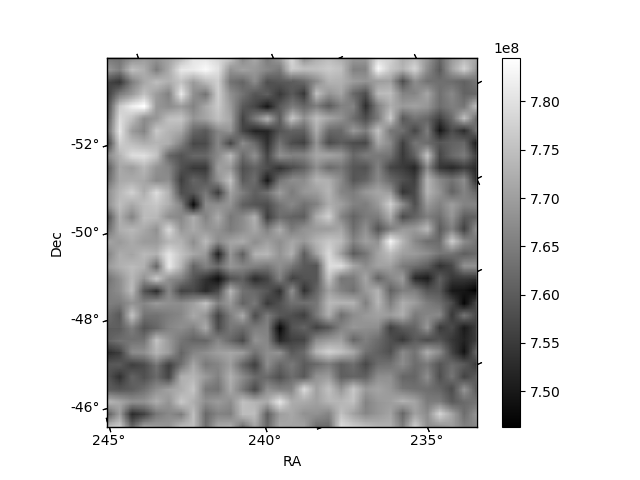
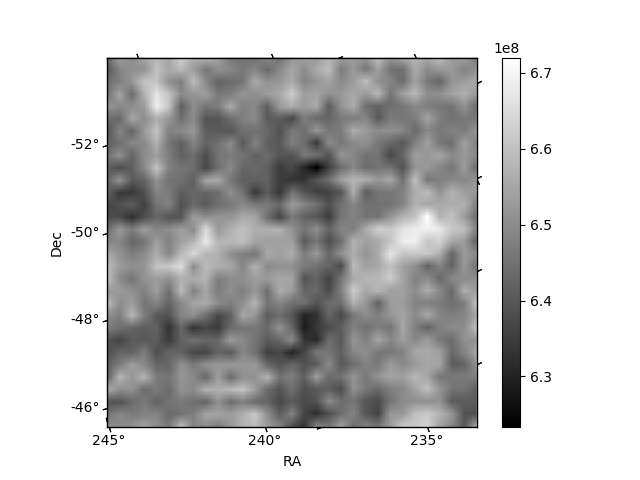
Histogram calculated using DETX and DETY for each event in the final _common_clean file
| Quadrant A | 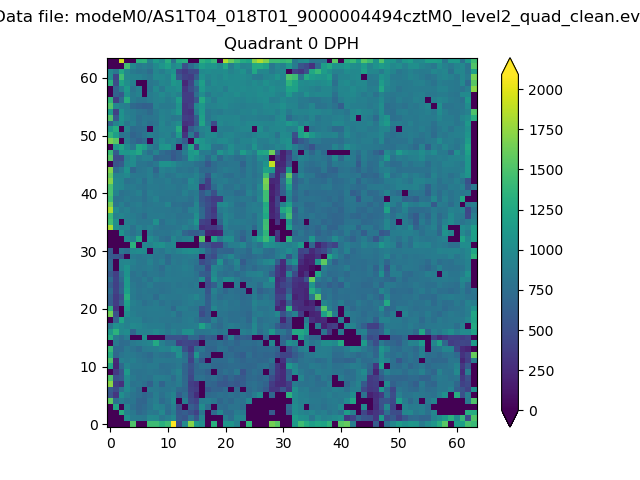 |
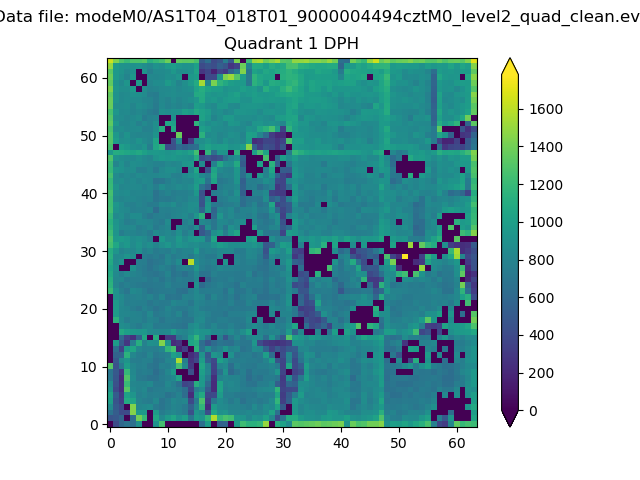 |
Quadrant B |
|---|---|---|---|
| Quadrant D |  |
 |
Quadrant C |
| Plot type | Count rate plots | Images |
|---|---|---|
| Comparison with Poisson distribution Blue bars denote a histogram of data divided into 1 sec bins. Red curve is a Poisson curve with rate = median count rate of data. |
 |
 |
| Quadrant-wise count rates Data is divided into 100 sec bins |
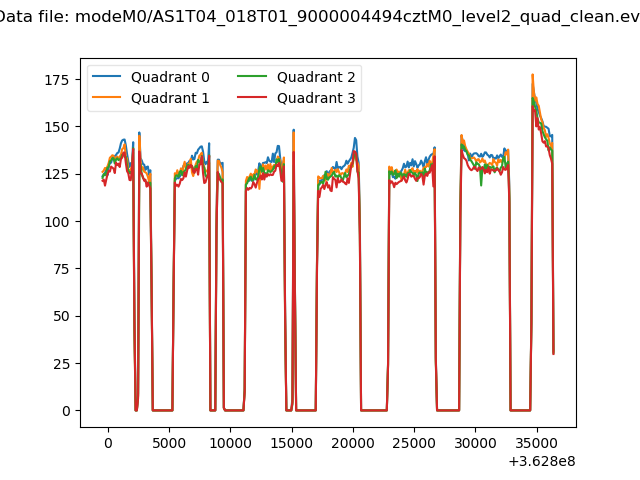 |
|
| Module-wise count rates for Quadrant A Data is divided into 100 sec bins |
 |
 |
| Module-wise count rates for Quadrant B Data is divided into 100 sec bins |
 |
 |
| Module-wise count rates for Quadrant C Data is divided into 100 sec bins |
 |
 |
| Module-wise count rates for Quadrant D Data is divided into 100 sec bins |
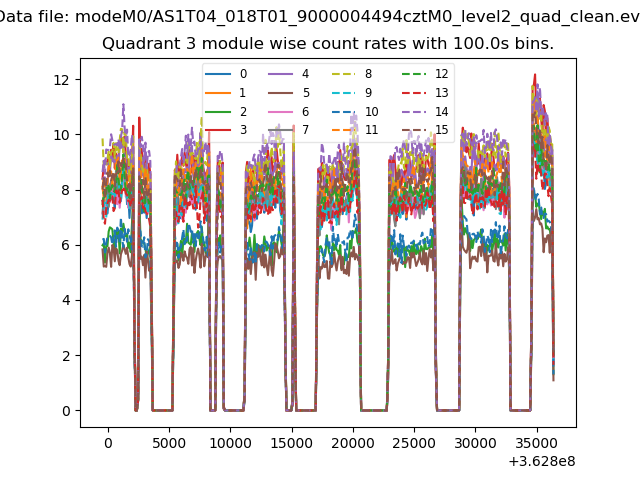 |
 |
| Parameter | Plot |
|---|---|
| CZT HV Monitor | 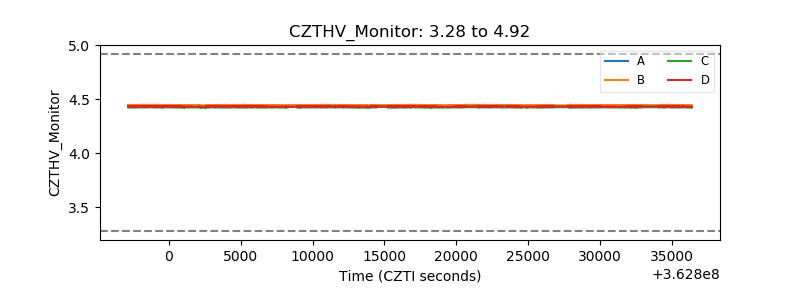 |
| D_VDD |  |
| Temperature 1 |  |
| Veto HV Monitor | 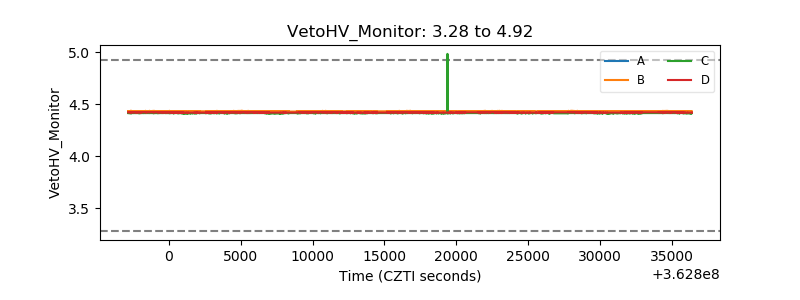 |
| Veto LLD |  |
| Alpha Counter |  |
| _CPM_Rate |  |
| CZT Counter | 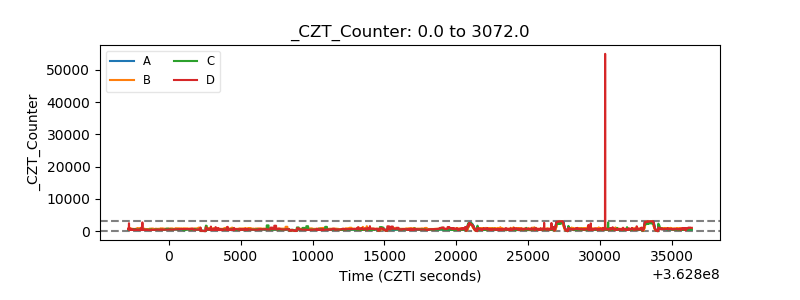 |
| +2.5 Volts monitor |  |
| +5 Volts monitor |  |
| _ROLL_ROT | 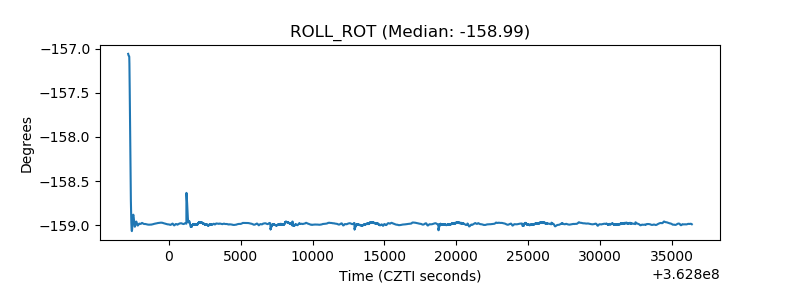 |
| _Roll_DEC |  |
| _Roll_RA |  |
| Veto Counter | 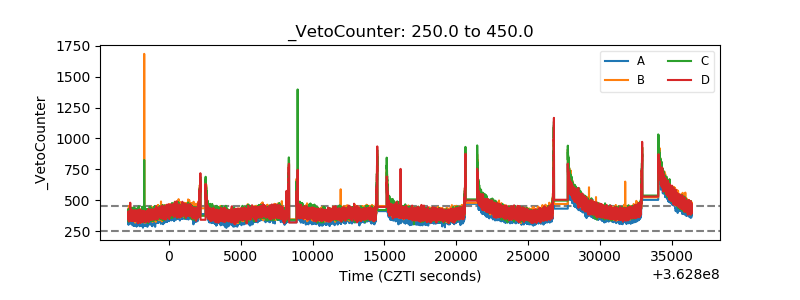 |