| Param | Original file | Final file |
|---|---|---|
| Filename | modeM0/AS1A10_071T66_9000004498cztM0_level2_bc.evt | modeM0/AS1A10_071T66_9000004498cztM0_level2_quad_clean.evt |
| Size (bytes) | 2,158,329,600 | 521,184,960 |
| Size | 2.0 GB | 497.0 MB |
| Events in quadrant A | 8,493,130 | 3,356,909 |
| Events in quadrant B | 20,657,149 | 3,324,835 |
| Events in quadrant C | 9,678,840 | 3,215,988 |
| Events in quadrant D | 23,727,128 | 3,050,213 |
| Mode M0 | |||
|---|---|---|---|
| Quadrant | BADHDUFLAG | Total packets | Discarded packets |
| A | 0 | 85425 | 0 |
| B | 0 | 126943 | 0 |
| C | 0 | 90476 | 0 |
| D | 0 | 137230 | 0 |
| Mode M9 | |||
|---|---|---|---|
| Quadrant | BADHDUFLAG | Total packets | Discarded packets |
| A | 0 | 52 | 0 |
| B | 0 | 52 | 0 |
| C | 0 | 52 | 0 |
| D | 0 | 52 | 0 |
| Mode SS | |||
|---|---|---|---|
| Quadrant | BADHDUFLAG | Total packets | Discarded packets |
| A | 0 | 842 | 0 |
| B | 0 | 842 | 0 |
| C | 0 | 842 | 0 |
| D | 0 | 842 | 0 |
| Quadrant | Total seconds | Saturated seconds | Saturation percentage |
|---|---|---|---|
| A | 41329 | 434 | 1.050110% |
| B | 41329 | 924 | 2.235718% |
| C | 41329 | 958 | 2.317985% |
| D | 41329 | 2164 | 5.236033% |
Noise dominated data is calculated using 1-second bins in cleaned event files. If a bin has >2000 counts, and if more than 50% of those come from <1% of pixels, then it is considered to be noise-dominated and hence unusable.
| Quadrant | # 1 sec bins | Bins with >0 counts | Bins with >2000 counts | High rate bins dominated by noise | Noise dominated (total time) | Noise dominated (detector-on time) | Marked lightcurve |
|---|---|---|---|---|---|---|---|
| A | 46444 | 41329 | 8 | 8 | 0.02% | 0.02% |  |
| B | 46444 | 41331 | 4 | 4 | 0.01% | 0.01% | 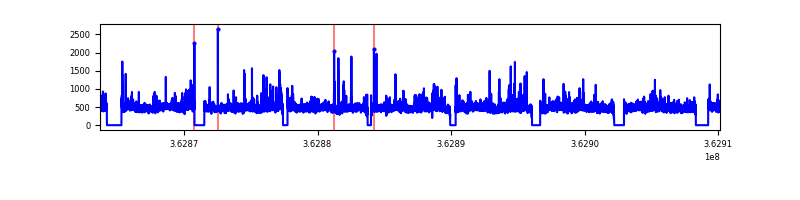 |
| C | 46444 | 41329 | 42 | 42 | 0.09% | 0.10% |  |
| D | 46444 | 41329 | 176 | 176 | 0.38% | 0.43% |  |
Top three noisy pixels from each quadrant. If the there are fewer than three noisy pixels in the level2.evt file, extra rows are filled as -1
| Pixel properties | Quadrant properties | ||||||
|---|---|---|---|---|---|---|---|
| Quadrant | DetID | PixID | Counts | Sigma | Mean | Median | Sigma |
| A | 12 | 96 | 91199 | 188.99 | 2159 | 2118 | 471.4 |
| A | 13 | 254 | 77721 | 160.39 | 2159 | 2118 | 471.4 |
| A | 11 | 47 | 29650 | 58.41 | 2159 | 2118 | 471.4 |
| B | 6 | 159 | 11247258 | 27086.79 | 2159 | 2105 | 415.2 |
| B | 0 | 183 | 351962 | 842.72 | 2159 | 2105 | 415.2 |
| B | 0 | 190 | 346165 | 828.76 | 2159 | 2105 | 415.2 |
| C | 0 | 10 | 697539 | 1413.04 | 2067 | 2055 | 492.2 |
| C | 15 | 208 | 383846 | 775.7 | 2067 | 2055 | 492.2 |
| C | 3 | 233 | 276729 | 558.06 | 2067 | 2055 | 492.2 |
| D | 8 | 195 | 12334386 | 23396.71 | 2062 | 2007 | 527.1 |
| D | 13 | 174 | 1399568 | 2651.42 | 2062 | 2007 | 527.1 |
| D | 2 | 250 | 995722 | 1885.25 | 2062 | 2007 | 527.1 |
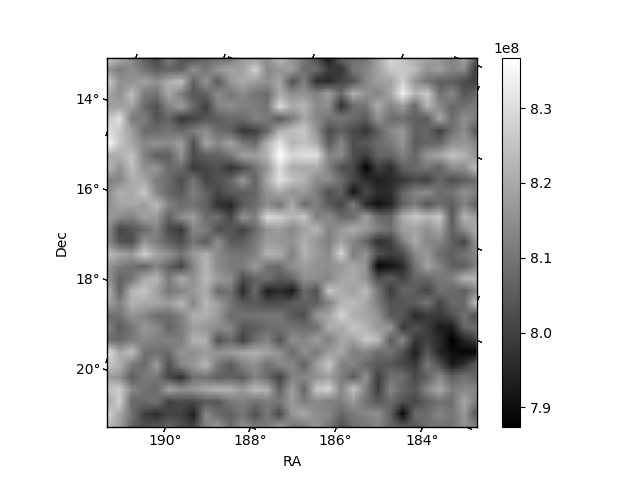
Histogram calculated using DETX and DETY for each event in the final _common_clean file
| Quadrant A |  |
 |
Quadrant B |
|---|---|---|---|
| Quadrant D |  |
 |
Quadrant C |
| Plot type | Count rate plots | Images |
|---|---|---|
| Comparison with Poisson distribution Blue bars denote a histogram of data divided into 1 sec bins. Red curve is a Poisson curve with rate = median count rate of data. |
 |
 |
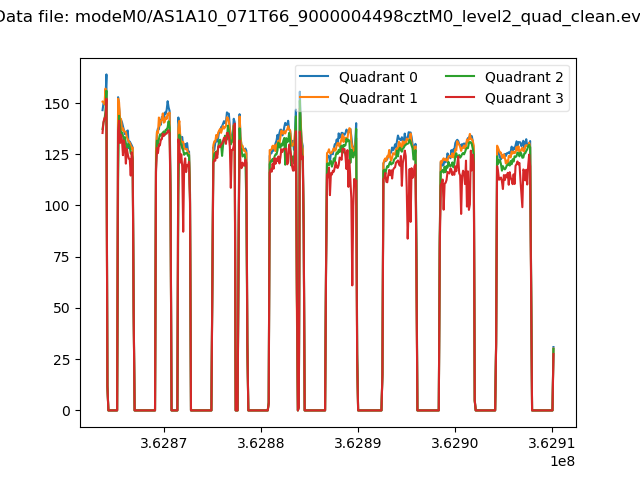
| Quadrant-wise count rates Data is divided into 100 sec bins |
 |
|
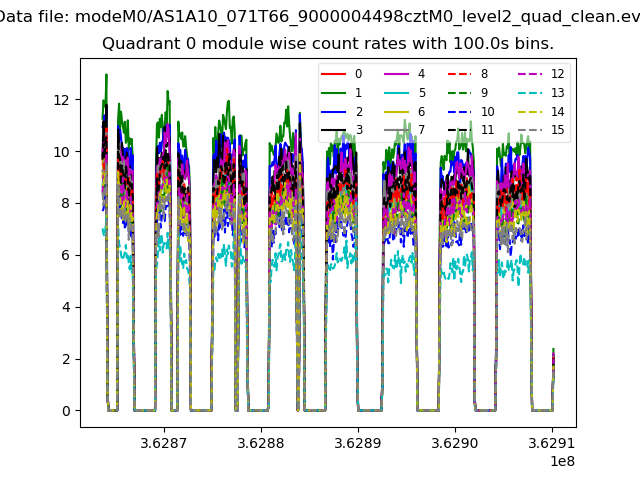
| Module-wise count rates for Quadrant A Data is divided into 100 sec bins |
 |
 |
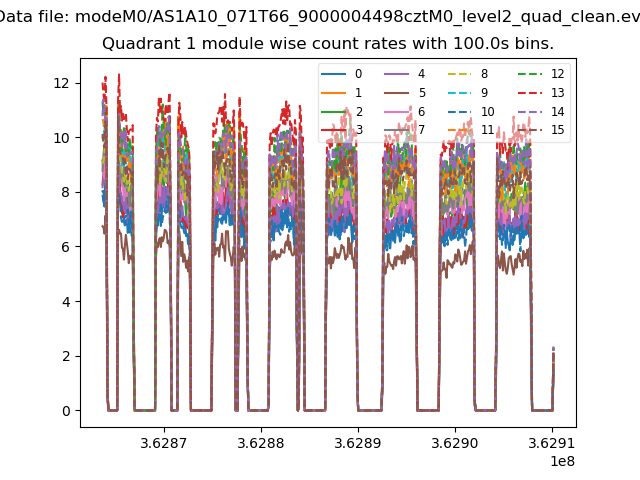
| Module-wise count rates for Quadrant B Data is divided into 100 sec bins |
 |
 |
| Module-wise count rates for Quadrant C Data is divided into 100 sec bins |
 |
 |
| Module-wise count rates for Quadrant D Data is divided into 100 sec bins |
 |
 |
| Parameter | Plot |
|---|---|
| CZT HV Monitor |  |
| D_VDD | 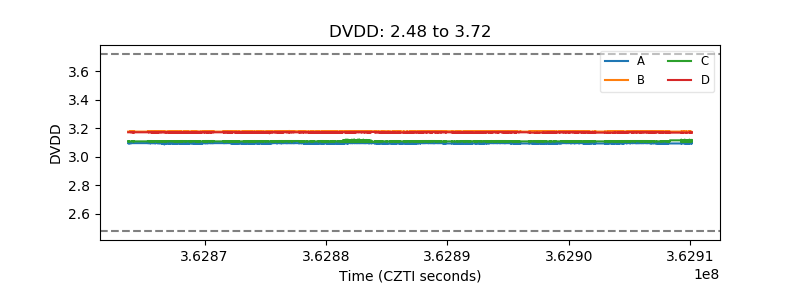 |
| Temperature 1 |  |
| Veto HV Monitor |  |
| Veto LLD | 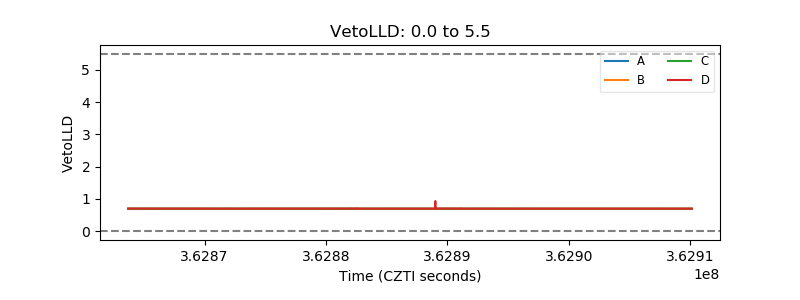 |
| Alpha Counter | 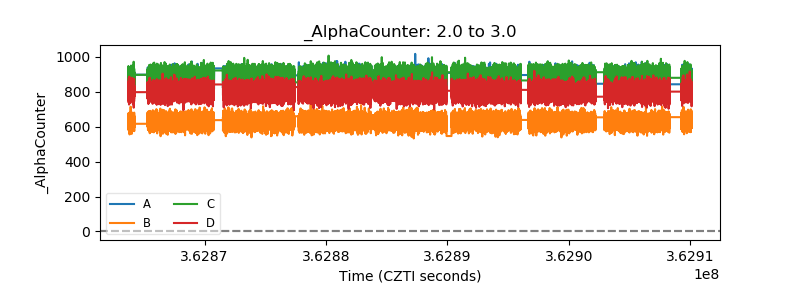 |
| _CPM_Rate |  |
| CZT Counter |  |
| +2.5 Volts monitor | 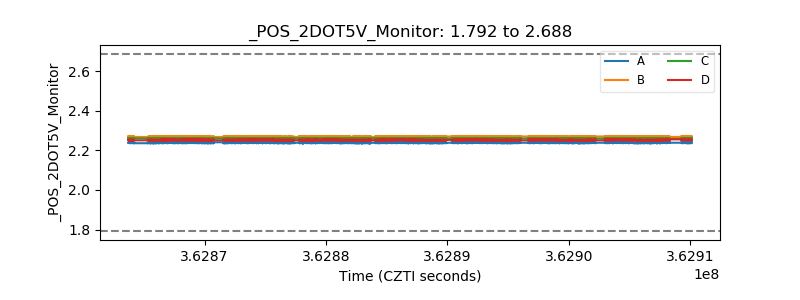 |
| +5 Volts monitor |  |
| _ROLL_ROT |  |
| _Roll_DEC |  |
| _Roll_RA |  |
| Veto Counter |  |