| Param | Original file | Final file |
|---|---|---|
| Filename | modeM0/AS1A10_109T01_9000004492cztM0_level2_bc.evt | modeM0/AS1A10_109T01_9000004492cztM0_level2_quad_clean.evt |
| Size (bytes) | 12,549,159,360 | 4,080,286,080 |
| Size | 11.7 GB | 3.8 GB |
| Events in quadrant A | 61,946,623 | 26,889,278 |
| Events in quadrant B | 137,120,576 | 26,663,843 |
| Events in quadrant C | 70,858,904 | 25,899,243 |
| Events in quadrant D | 91,616,547 | 25,471,483 |
| Mode M0 | |||
|---|---|---|---|
| Quadrant | BADHDUFLAG | Total packets | Discarded packets |
| A | 0 | 578221 | 0 |
| B | 0 | 832371 | 0 |
| C | 0 | 624383 | 0 |
| D | 0 | 670511 | 0 |
| Mode SS | |||
|---|---|---|---|
| Quadrant | BADHDUFLAG | Total packets | Discarded packets |
| A | 0 | 5558 | 0 |
| B | 0 | 5554 | 0 |
| C | 0 | 5556 | 0 |
| D | 0 | 5562 | 0 |
| Mode M9 | |||
|---|---|---|---|
| Quadrant | BADHDUFLAG | Total packets | Discarded packets |
| A | 0 | 456 | 0 |
| B | 0 | 456 | 0 |
| C | 0 | 456 | 0 |
| D | 0 | 456 | 0 |
| Quadrant | Total seconds | Saturated seconds | Saturation percentage |
|---|---|---|---|
| A | 272691 | 3102 | 1.137551% |
| B | 272552 | 6535 | 2.397708% |
| C | 272732 | 9179 | 3.365575% |
| D | 272664 | 4594 | 1.684858% |
Noise dominated data is calculated using 1-second bins in cleaned event files. If a bin has >2000 counts, and if more than 50% of those come from <1% of pixels, then it is considered to be noise-dominated and hence unusable.
| Quadrant | # 1 sec bins | Bins with >0 counts | Bins with >2000 counts | High rate bins dominated by noise | Noise dominated (total time) | Noise dominated (detector-on time) | Marked lightcurve |
|---|---|---|---|---|---|---|---|
| A | 319106 | 272941 | 13 | 13 | 0.00% | 0.00% | 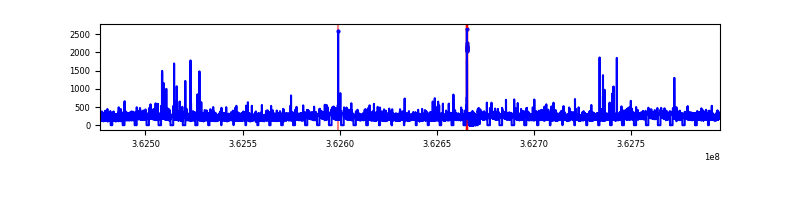 |
| B | 319106 | 272809 | 5 | 5 | 0.00% | 0.00% |  |
| C | 319106 | 272983 | 127 | 127 | 0.04% | 0.05% |  |
| D | 319106 | 272922 | 230 | 230 | 0.07% | 0.08% | 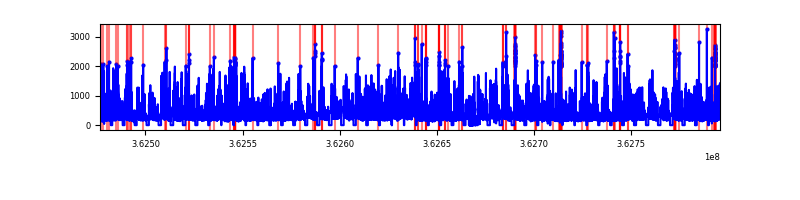 |
Top three noisy pixels from each quadrant. If the there are fewer than three noisy pixels in the level2.evt file, extra rows are filled as -1
| Pixel properties | Quadrant properties | ||||||
|---|---|---|---|---|---|---|---|
| Quadrant | DetID | PixID | Counts | Sigma | Mean | Median | Sigma |
| A | 13 | 254 | 450266 | 126.02 | 15923 | 15714 | 3448.4 |
| A | 13 | 170 | 392658 | 109.31 | 15923 | 15714 | 3448.4 |
| A | 12 | 96 | 98292 | 23.95 | 15923 | 15714 | 3448.4 |
| B | 6 | 159 | 73257948 | 24259.39 | 15921 | 15665 | 3019.1 |
| B | 0 | 183 | 1178346 | 385.1 | 15921 | 15665 | 3019.1 |
| B | 0 | 190 | 709988 | 229.97 | 15921 | 15665 | 3019.1 |
| C | 0 | 10 | 6101798 | 1693.05 | 15314 | 15375 | 3594.9 |
| C | 10 | 22 | 3781457 | 1047.6 | 15314 | 15375 | 3594.9 |
| C | 15 | 208 | 899093 | 245.82 | 15314 | 15375 | 3594.9 |
| D | 8 | 195 | 16812187 | 4690.13 | 15661 | 15229 | 3581.3 |
| D | 13 | 174 | 11707256 | 3264.7 | 15661 | 15229 | 3581.3 |
| D | 2 | 250 | 1074079 | 295.66 | 15661 | 15229 | 3581.3 |
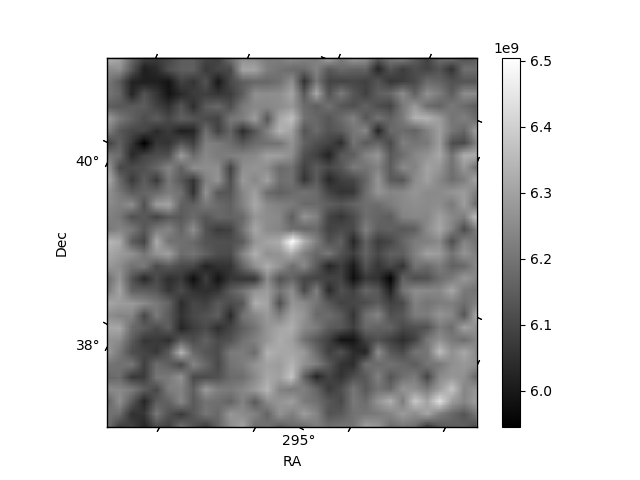
Histogram calculated using DETX and DETY for each event in the final _common_clean file
| Quadrant A |  |
 |
Quadrant B |
|---|---|---|---|
| Quadrant D |  |
 |
Quadrant C |
| Plot type | Count rate plots | Images |
|---|---|---|
| Comparison with Poisson distribution Blue bars denote a histogram of data divided into 1 sec bins. Red curve is a Poisson curve with rate = median count rate of data. |
 |
 |
| Quadrant-wise count rates Data is divided into 100 sec bins |
 |
|
| Module-wise count rates for Quadrant A Data is divided into 100 sec bins |
 |
 |
| Module-wise count rates for Quadrant B Data is divided into 100 sec bins |
 |
 |
| Module-wise count rates for Quadrant C Data is divided into 100 sec bins |
 |
 |
| Module-wise count rates for Quadrant D Data is divided into 100 sec bins |
 |
 |
| Parameter | Plot |
|---|---|
| CZT HV Monitor |  |
| D_VDD |  |
| Temperature 1 |  |
| Veto HV Monitor |  |
| Veto LLD |  |
| Alpha Counter |  |
| _CPM_Rate |  |
| CZT Counter |  |
| +2.5 Volts monitor | 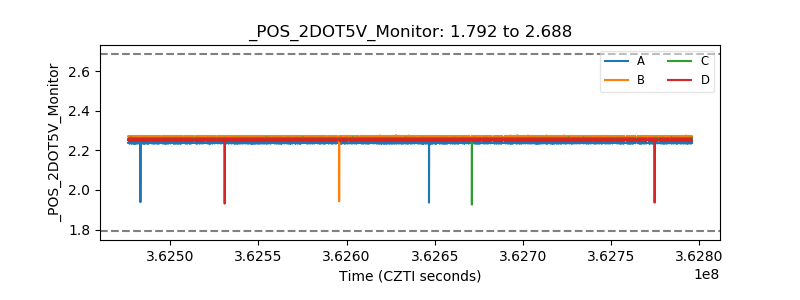 |
| +5 Volts monitor |  |
| _ROLL_ROT |  |
| _Roll_DEC |  |
| _Roll_RA |  |
| Veto Counter |  |