| Param | Original file | Final file |
|---|---|---|
| Filename | modeM0/AS1C06_002T01_9000004490cztM0_level2_bc.evt | modeM0/AS1C06_002T01_9000004490cztM0_level2_quad_clean.evt |
| Size (bytes) | 5,313,980,160 | 1,581,600,960 |
| Size | 4.9 GB | 1.5 GB |
| Events in quadrant A | 20,468,241 | 10,900,737 |
| Events in quadrant B | 51,913,473 | 10,714,449 |
| Events in quadrant C | 22,264,296 | 10,546,360 |
| Events in quadrant D | 59,603,896 | 8,998,269 |
| Mode M0 | |||
|---|---|---|---|
| Quadrant | BADHDUFLAG | Total packets | Discarded packets |
| A | 0 | 202868 | 0 |
| B | 0 | 309081 | 0 |
| C | 0 | 211490 | 0 |
| D | 0 | 378234 | 0 |
| Mode M9 | |||
|---|---|---|---|
| Quadrant | BADHDUFLAG | Total packets | Discarded packets |
| A | 0 | 129 | 0 |
| B | 0 | 129 | 0 |
| C | 0 | 129 | 0 |
| D | 0 | 129 | 0 |
| Mode SS | |||
|---|---|---|---|
| Quadrant | BADHDUFLAG | Total packets | Discarded packets |
| A | 0 | 2008 | 0 |
| B | 0 | 2008 | 0 |
| C | 0 | 2008 | 0 |
| D | 0 | 2008 | 0 |
| Quadrant | Total seconds | Saturated seconds | Saturation percentage |
|---|---|---|---|
| A | 98344 | 1029 | 1.046327% |
| B | 98344 | 3052 | 3.103392% |
| C | 98344 | 2355 | 2.394655% |
| D | 98344 | 19422 | 19.749044% |
Noise dominated data is calculated using 1-second bins in cleaned event files. If a bin has >2000 counts, and if more than 50% of those come from <1% of pixels, then it is considered to be noise-dominated and hence unusable.
| Quadrant | # 1 sec bins | Bins with >0 counts | Bins with >2000 counts | High rate bins dominated by noise | Noise dominated (total time) | Noise dominated (detector-on time) | Marked lightcurve |
|---|---|---|---|---|---|---|---|
| A | 113480 | 98345 | 1 | 1 | 0.00% | 0.00% |  |
| B | 113480 | 98347 | 62 | 62 | 0.05% | 0.06% |  |
| C | 113480 | 98347 | 6 | 6 | 0.01% | 0.01% |  |
| D | 113480 | 98346 | 853 | 853 | 0.75% | 0.87% |  |
Top three noisy pixels from each quadrant. If the there are fewer than three noisy pixels in the level2.evt file, extra rows are filled as -1
| Pixel properties | Quadrant properties | ||||||
|---|---|---|---|---|---|---|---|
| Quadrant | DetID | PixID | Counts | Sigma | Mean | Median | Sigma |
| A | 13 | 254 | 182172 | 155.26 | 5271 | 5187 | 1139.9 |
| A | 12 | 96 | 76418 | 62.49 | 5271 | 5187 | 1139.9 |
| A | 0 | 226 | 33410 | 24.76 | 5271 | 5187 | 1139.9 |
| B | 6 | 159 | 27693484 | 27917.36 | 5250 | 5145 | 991.8 |
| B | 5 | 172 | 1229779 | 1234.76 | 5250 | 5145 | 991.8 |
| B | 0 | 183 | 769955 | 771.14 | 5250 | 5145 | 991.8 |
| C | 0 | 10 | 1120973 | 922.98 | 5102 | 5097 | 1209.0 |
| C | 3 | 233 | 566232 | 464.13 | 5102 | 5097 | 1209.0 |
| C | 1 | 16 | 217808 | 175.94 | 5102 | 5097 | 1209.0 |
| D | 13 | 174 | 22464368 | 20637.62 | 4634 | 4491 | 1088.3 |
| D | 8 | 195 | 14552594 | 13367.76 | 4634 | 4491 | 1088.3 |
| D | 13 | 249 | 1839291 | 1685.94 | 4634 | 4491 | 1088.3 |
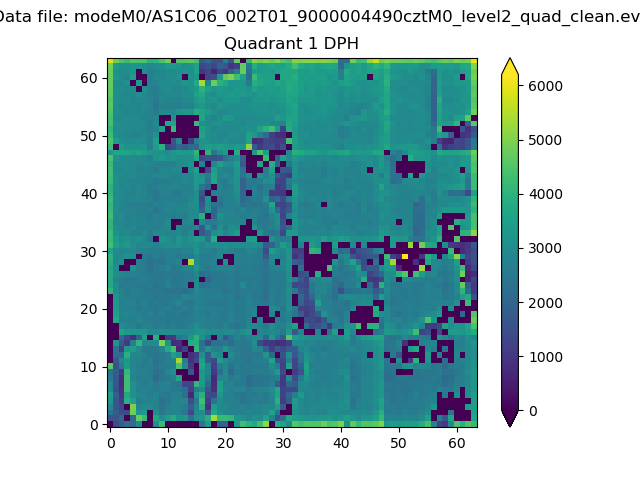
Histogram calculated using DETX and DETY for each event in the final _common_clean file
| Quadrant A |  |
 |
Quadrant B |
|---|---|---|---|
| Quadrant D | 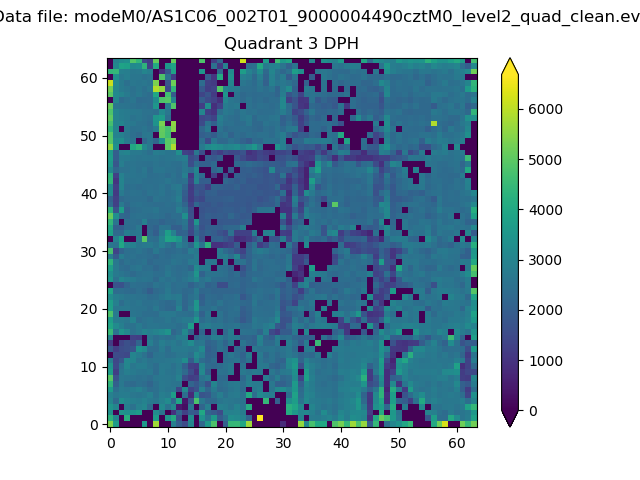 |
 |
Quadrant C |
| Plot type | Count rate plots | Images |
|---|---|---|
| Comparison with Poisson distribution Blue bars denote a histogram of data divided into 1 sec bins. Red curve is a Poisson curve with rate = median count rate of data. |
 |
 |
| Quadrant-wise count rates Data is divided into 100 sec bins |
 |
|
| Module-wise count rates for Quadrant A Data is divided into 100 sec bins |
 |
 |
| Module-wise count rates for Quadrant B Data is divided into 100 sec bins |
 |
 |
| Module-wise count rates for Quadrant C Data is divided into 100 sec bins |
 |
 |
| Module-wise count rates for Quadrant D Data is divided into 100 sec bins |
 |
 |
| Parameter | Plot |
|---|---|
| CZT HV Monitor | 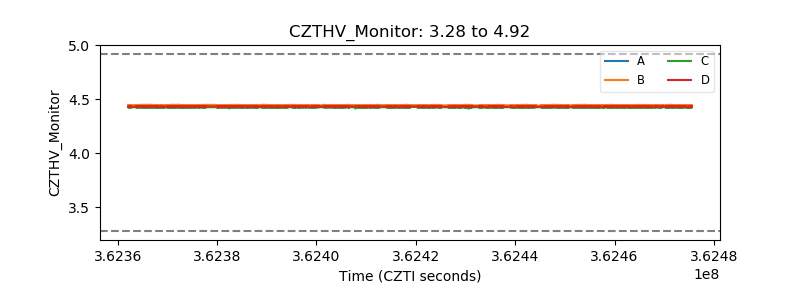 |
| D_VDD |  |
| Temperature 1 |  |
| Veto HV Monitor |  |
| Veto LLD | 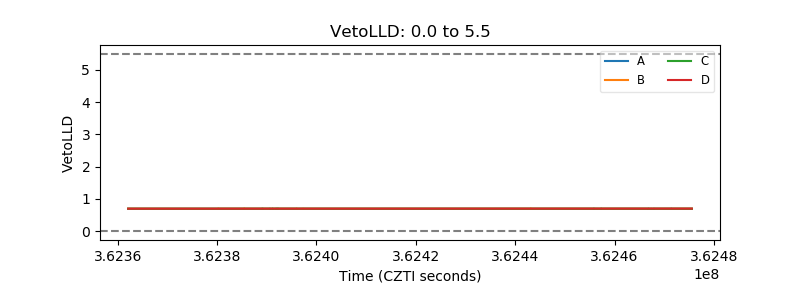 |
| Alpha Counter |  |
| _CPM_Rate |  |
| CZT Counter |  |
| +2.5 Volts monitor |  |
| +5 Volts monitor |  |
| _ROLL_ROT |  |
| _Roll_DEC |  |
| _Roll_RA |  |
| Veto Counter |  |