| Param | Original file | Final file |
|---|---|---|
| Filename | modeM0/AS1A10_071T69_9000004488cztM0_level2_bc.evt | modeM0/AS1A10_071T69_9000004488cztM0_level2_quad_clean.evt |
| Size (bytes) | 585,403,200 | 123,353,280 |
| Size | 558.3 MB | 117.6 MB |
| Events in quadrant A | 2,507,905 | 758,360 |
| Events in quadrant B | 6,140,661 | 754,823 |
| Events in quadrant C | 2,738,476 | 718,703 |
| Events in quadrant D | 5,519,655 | 673,704 |
| Mode SS | |||
|---|---|---|---|
| Quadrant | BADHDUFLAG | Total packets | Discarded packets |
| A | 0 | 244 | 0 |
| B | 0 | 244 | 0 |
| C | 0 | 244 | 0 |
| D | 0 | 244 | 0 |
| Mode M9 | |||
|---|---|---|---|
| Quadrant | BADHDUFLAG | Total packets | Discarded packets |
| A | 0 | 18 | 0 |
| B | 0 | 18 | 0 |
| C | 0 | 18 | 0 |
| D | 0 | 18 | 0 |
| Mode M0 | |||
|---|---|---|---|
| Quadrant | BADHDUFLAG | Total packets | Discarded packets |
| A | 0 | 24765 | 0 |
| B | 0 | 36950 | 0 |
| C | 0 | 25834 | 0 |
| D | 0 | 35974 | 0 |
| Quadrant | Total seconds | Saturated seconds | Saturation percentage |
|---|---|---|---|
| A | 11996 | 56 | 0.466822% |
| B | 11996 | 290 | 2.417472% |
| C | 11996 | 265 | 2.209070% |
| D | 11996 | 806 | 6.718906% |
Noise dominated data is calculated using 1-second bins in cleaned event files. If a bin has >2000 counts, and if more than 50% of those come from <1% of pixels, then it is considered to be noise-dominated and hence unusable.
| Quadrant | # 1 sec bins | Bins with >0 counts | Bins with >2000 counts | High rate bins dominated by noise | Noise dominated (total time) | Noise dominated (detector-on time) | Marked lightcurve |
|---|---|---|---|---|---|---|---|
| A | 13826 | 11996 | 0 | 0 | 0.00% | 0.00% |  |
| B | 13826 | 11996 | 0 | 0 | 0.00% | 0.00% |  |
| C | 13825 | 11995 | 0 | 0 | 0.00% | 0.00% | 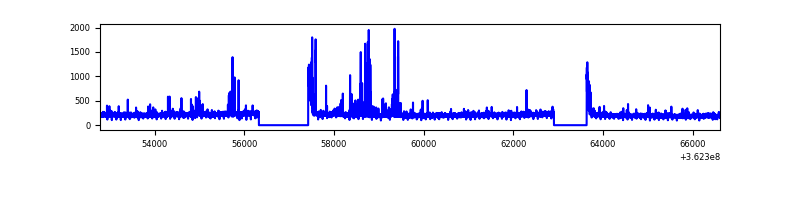 |
| D | 13826 | 11996 | 54 | 54 | 0.39% | 0.45% |  |
Top three noisy pixels from each quadrant. If the there are fewer than three noisy pixels in the level2.evt file, extra rows are filled as -1
| Pixel properties | Quadrant properties | ||||||
|---|---|---|---|---|---|---|---|
| Quadrant | DetID | PixID | Counts | Sigma | Mean | Median | Sigma |
| A | 13 | 254 | 21062 | 145.02 | 644 | 633 | 140.9 |
| A | 12 | 96 | 14352 | 97.39 | 644 | 633 | 140.9 |
| A | 0 | 226 | 4045 | 24.22 | 644 | 633 | 140.9 |
| B | 6 | 159 | 3374056 | 27135.03 | 646 | 631 | 124.3 |
| B | 4 | 80 | 114799 | 918.34 | 646 | 631 | 124.3 |
| B | 0 | 190 | 60319 | 480.12 | 646 | 631 | 124.3 |
| C | 0 | 10 | 122993 | 838.39 | 616 | 613 | 146.0 |
| C | 3 | 233 | 89868 | 611.46 | 616 | 613 | 146.0 |
| C | 15 | 208 | 46813 | 316.5 | 616 | 613 | 146.0 |
| D | 8 | 195 | 1291555 | 9247.32 | 604 | 585 | 139.6 |
| D | 13 | 174 | 1278195 | 9151.62 | 604 | 585 | 139.6 |
| D | 6 | 219 | 246208 | 1759.42 | 604 | 585 | 139.6 |
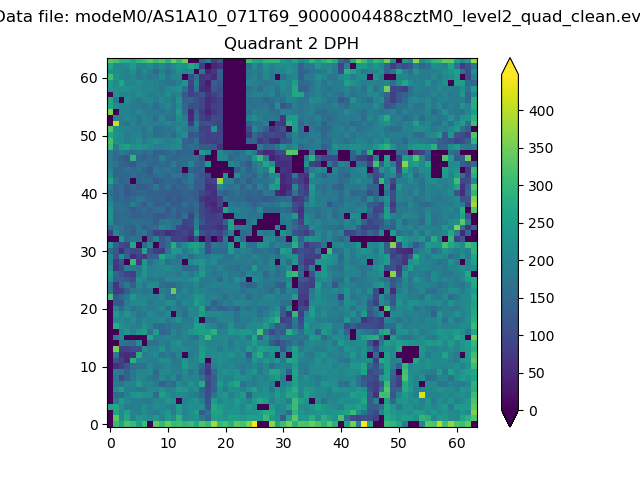
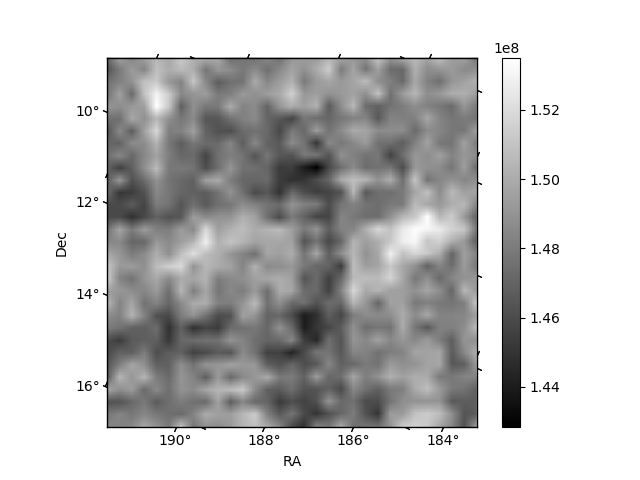
Histogram calculated using DETX and DETY for each event in the final _common_clean file
| Quadrant A |  |
 |
Quadrant B |
|---|---|---|---|
| Quadrant D |  |
 |
Quadrant C |
| Plot type | Count rate plots | Images |
|---|---|---|
| Comparison with Poisson distribution Blue bars denote a histogram of data divided into 1 sec bins. Red curve is a Poisson curve with rate = median count rate of data. |
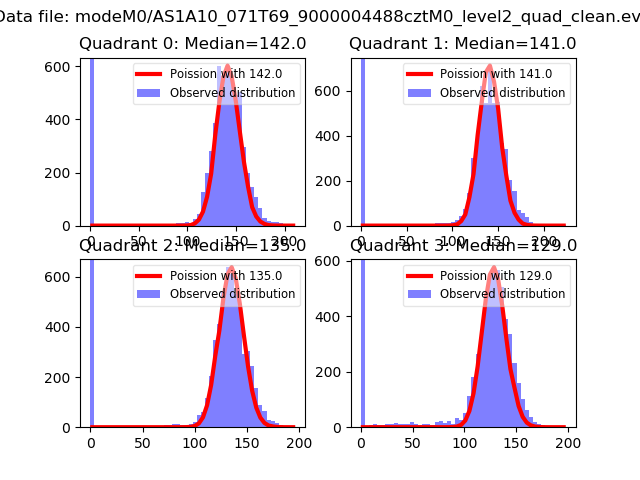 |
 |
| Quadrant-wise count rates Data is divided into 100 sec bins |
 |
|
| Module-wise count rates for Quadrant A Data is divided into 100 sec bins |
 |
 |
| Module-wise count rates for Quadrant B Data is divided into 100 sec bins |
 |
 |
| Module-wise count rates for Quadrant C Data is divided into 100 sec bins |
 |
 |
| Module-wise count rates for Quadrant D Data is divided into 100 sec bins |
 |
 |
| Parameter | Plot |
|---|---|
| CZT HV Monitor |  |
| D_VDD | 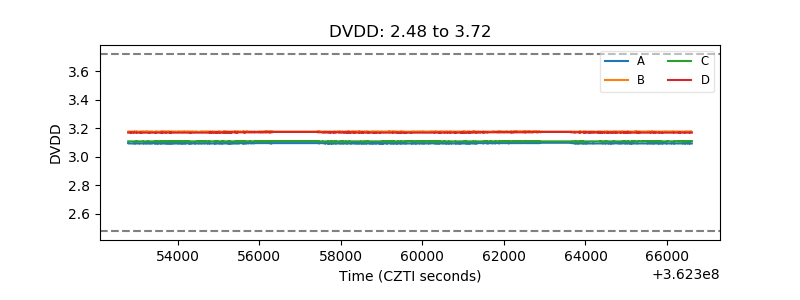 |
| Temperature 1 |  |
| Veto HV Monitor | 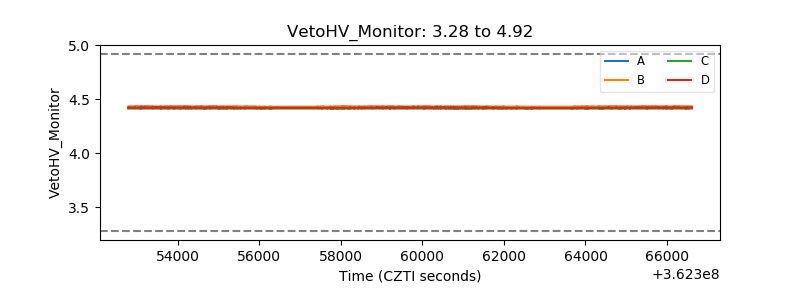 |
| Veto LLD |  |
| Alpha Counter | 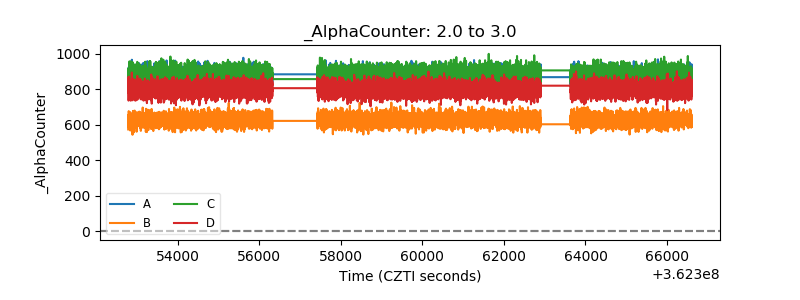 |
| _CPM_Rate |  |
| CZT Counter | 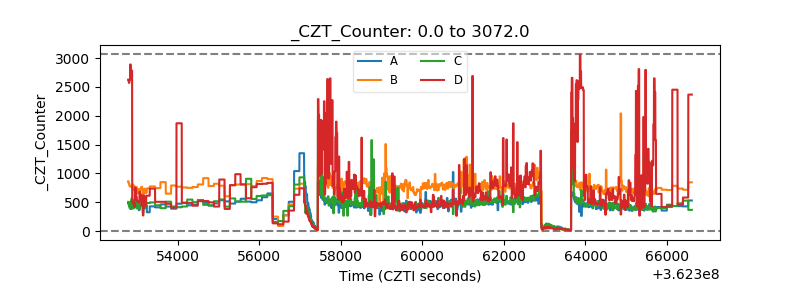 |
| +2.5 Volts monitor |  |
| +5 Volts monitor |  |
| _ROLL_ROT |  |
| _Roll_DEC |  |
| _Roll_RA | 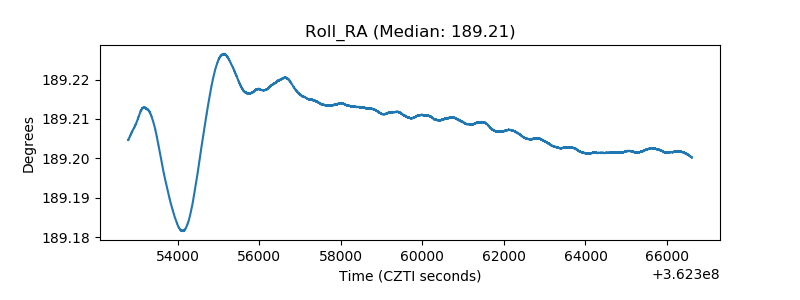 |
| Veto Counter |  |