| Param | Original file | Final file |
|---|---|---|
| Filename | modeM0/AS1A10_071T63_9000004486cztM0_level2_bc.evt | modeM0/AS1A10_071T63_9000004486cztM0_level2_quad_clean.evt |
| Size (bytes) | 3,177,720,000 | 907,827,840 |
| Size | 3.0 GB | 865.8 MB |
| Events in quadrant A | 14,526,006 | 5,904,649 |
| Events in quadrant B | 35,367,025 | 5,857,306 |
| Events in quadrant C | 15,295,102 | 5,625,794 |
| Events in quadrant D | 26,416,827 | 5,436,410 |
| Mode M9 | |||
|---|---|---|---|
| Quadrant | BADHDUFLAG | Total packets | Discarded packets |
| A | 0 | 108 | 0 |
| B | 0 | 108 | 0 |
| C | 0 | 108 | 0 |
| D | 0 | 108 | 0 |
| Mode SS | |||
|---|---|---|---|
| Quadrant | BADHDUFLAG | Total packets | Discarded packets |
| A | 0 | 1392 | 0 |
| B | 0 | 1392 | 0 |
| C | 0 | 1392 | 0 |
| D | 0 | 1392 | 0 |
| Mode M0 | |||
|---|---|---|---|
| Quadrant | BADHDUFLAG | Total packets | Discarded packets |
| A | 0 | 142461 | 0 |
| B | 0 | 213834 | 0 |
| C | 0 | 146393 | 0 |
| D | 0 | 177911 | 0 |
| Quadrant | Total seconds | Saturated seconds | Saturation percentage |
|---|---|---|---|
| A | 68142 | 987 | 1.448446% |
| B | 68142 | 2189 | 3.212409% |
| C | 68142 | 1668 | 2.447830% |
| D | 68142 | 2090 | 3.067125% |
Noise dominated data is calculated using 1-second bins in cleaned event files. If a bin has >2000 counts, and if more than 50% of those come from <1% of pixels, then it is considered to be noise-dominated and hence unusable.
| Quadrant | # 1 sec bins | Bins with >0 counts | Bins with >2000 counts | High rate bins dominated by noise | Noise dominated (total time) | Noise dominated (detector-on time) | Marked lightcurve |
|---|---|---|---|---|---|---|---|
| A | 79036 | 68134 | 2 | 2 | 0.00% | 0.00% |  |
| B | 79036 | 68130 | 33 | 33 | 0.04% | 0.05% |  |
| C | 79036 | 68131 | 4 | 4 | 0.01% | 0.01% |  |
| D | 79036 | 68129 | 394 | 394 | 0.50% | 0.58% |  |
Top three noisy pixels from each quadrant. If the there are fewer than three noisy pixels in the level2.evt file, extra rows are filled as -1
| Pixel properties | Quadrant properties | ||||||
|---|---|---|---|---|---|---|---|
| Quadrant | DetID | PixID | Counts | Sigma | Mean | Median | Sigma |
| A | 13 | 254 | 123374 | 148.46 | 3748 | 3680 | 806.3 |
| A | 0 | 226 | 23916 | 25.1 | 3748 | 3680 | 806.3 |
| A | 12 | 194 | 22428 | 23.25 | 3748 | 3680 | 806.3 |
| B | 6 | 159 | 18409313 | 25942.72 | 3749 | 3662 | 709.5 |
| B | 0 | 190 | 543642 | 761.1 | 3749 | 3662 | 709.5 |
| B | 4 | 52 | 430949 | 602.26 | 3749 | 3662 | 709.5 |
| C | 3 | 233 | 547941 | 649.61 | 3575 | 3561 | 838.0 |
| C | 0 | 10 | 524442 | 621.57 | 3575 | 3561 | 838.0 |
| C | 1 | 16 | 200552 | 235.07 | 3575 | 3561 | 838.0 |
| D | 8 | 195 | 7733162 | 9313.83 | 3620 | 3501 | 829.9 |
| D | 1 | 52 | 1388309 | 1668.62 | 3620 | 3501 | 829.9 |
| D | 12 | 218 | 927136 | 1112.93 | 3620 | 3501 | 829.9 |
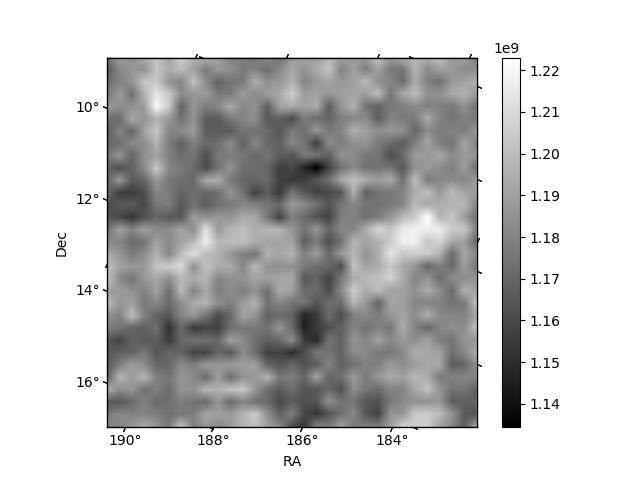
Histogram calculated using DETX and DETY for each event in the final _common_clean file
| Quadrant A |  |
 |
Quadrant B |
|---|---|---|---|
| Quadrant D |  |
 |
Quadrant C |
| Plot type | Count rate plots | Images |
|---|---|---|
| Comparison with Poisson distribution Blue bars denote a histogram of data divided into 1 sec bins. Red curve is a Poisson curve with rate = median count rate of data. |
 |
 |
| Quadrant-wise count rates Data is divided into 100 sec bins |
 |
|
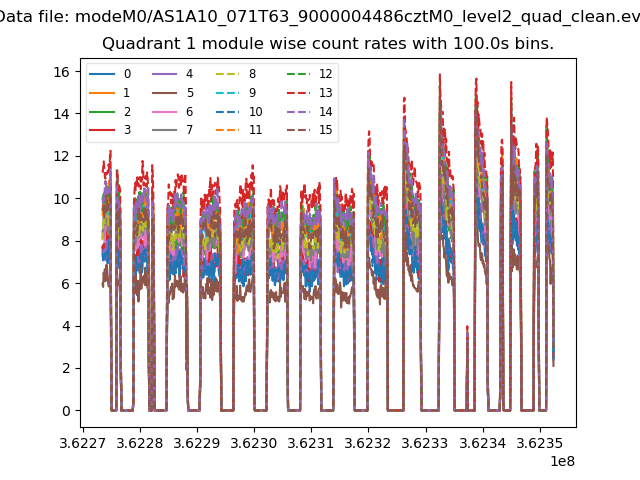
| Module-wise count rates for Quadrant A Data is divided into 100 sec bins |
 |
 |
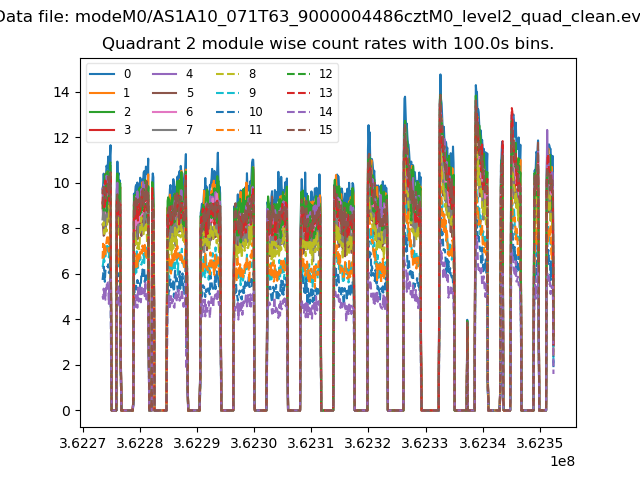
| Module-wise count rates for Quadrant B Data is divided into 100 sec bins |
 |
 |
| Module-wise count rates for Quadrant C Data is divided into 100 sec bins |
 |
 |
| Module-wise count rates for Quadrant D Data is divided into 100 sec bins |
 |
 |
| Parameter | Plot |
|---|---|
| CZT HV Monitor |  |
| D_VDD |  |
| Temperature 1 |  |
| Veto HV Monitor | 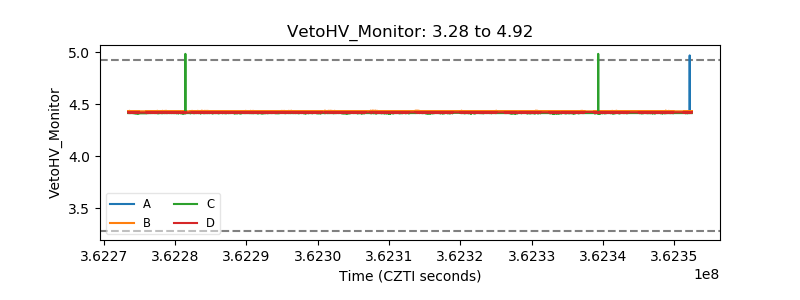 |
| Veto LLD |  |
| Alpha Counter |  |
| _CPM_Rate | 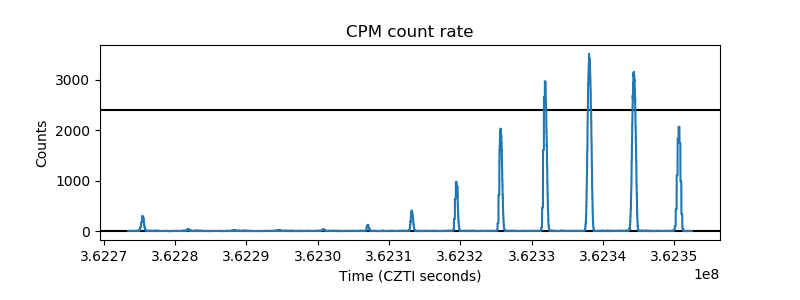 |
| CZT Counter |  |
| +2.5 Volts monitor |  |
| +5 Volts monitor |  |
| _ROLL_ROT | 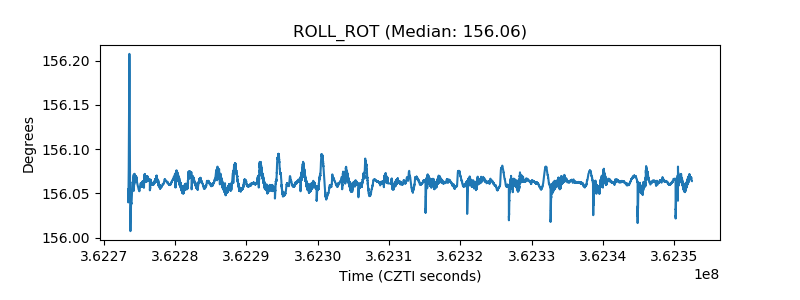 |
| _Roll_DEC |  |
| _Roll_RA |  |
| Veto Counter |  |