| Param | Original file | Final file |
|---|---|---|
| Filename | modeM0/AS1A10_071T56_9000004484cztM0_level2_bc.evt | modeM0/AS1A10_071T56_9000004484cztM0_level2_quad_clean.evt |
| Size (bytes) | 1,869,877,440 | 417,291,840 |
| Size | 1.7 GB | 398.0 MB |
| Events in quadrant A | 7,849,157 | 2,752,114 |
| Events in quadrant B | 17,730,852 | 2,736,024 |
| Events in quadrant C | 7,839,877 | 2,608,758 |
| Events in quadrant D | 20,959,695 | 2,268,077 |
| Mode M0 | |||
|---|---|---|---|
| Quadrant | BADHDUFLAG | Total packets | Discarded packets |
| A | 0 | 71268 | 0 |
| B | 0 | 104206 | 0 |
| C | 0 | 72261 | 0 |
| D | 0 | 121896 | 0 |
| Mode SS | |||
|---|---|---|---|
| Quadrant | BADHDUFLAG | Total packets | Discarded packets |
| A | 0 | 674 | 0 |
| B | 0 | 674 | 0 |
| C | 0 | 674 | 0 |
| D | 0 | 674 | 0 |
| Mode M9 | |||
|---|---|---|---|
| Quadrant | BADHDUFLAG | Total packets | Discarded packets |
| A | 0 | 75 | 0 |
| B | 0 | 75 | 0 |
| C | 0 | 75 | 0 |
| D | 0 | 75 | 0 |
| Quadrant | Total seconds | Saturated seconds | Saturation percentage |
|---|---|---|---|
| A | 33066 | 331 | 1.001028% |
| B | 33066 | 875 | 2.646223% |
| C | 33066 | 770 | 2.328676% |
| D | 33066 | 4800 | 14.516422% |
Noise dominated data is calculated using 1-second bins in cleaned event files. If a bin has >2000 counts, and if more than 50% of those come from <1% of pixels, then it is considered to be noise-dominated and hence unusable.
| Quadrant | # 1 sec bins | Bins with >0 counts | Bins with >2000 counts | High rate bins dominated by noise | Noise dominated (total time) | Noise dominated (detector-on time) | Marked lightcurve |
|---|---|---|---|---|---|---|---|
| A | 40596 | 33061 | 1 | 1 | 0.00% | 0.00% |  |
| B | 40596 | 33061 | 17 | 17 | 0.04% | 0.05% | 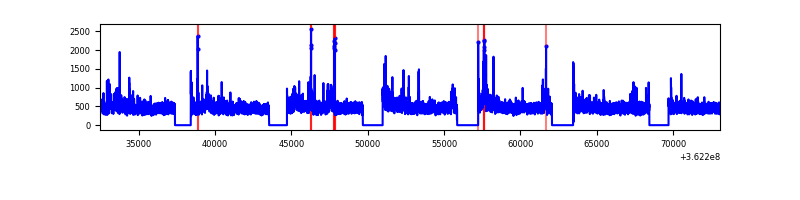 |
| C | 40596 | 33063 | 0 | 0 | 0.00% | 0.00% |  |
| D | 40596 | 33062 | 334 | 334 | 0.82% | 1.01% | 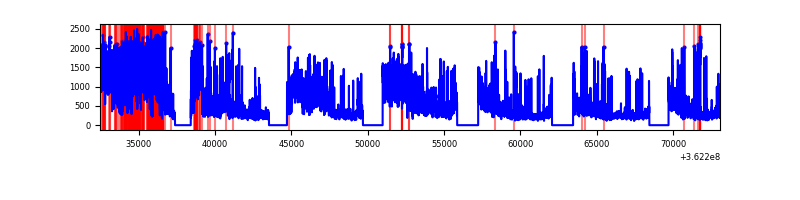 |
Top three noisy pixels from each quadrant. If the there are fewer than three noisy pixels in the level2.evt file, extra rows are filled as -1
| Pixel properties | Quadrant properties | ||||||
|---|---|---|---|---|---|---|---|
| Quadrant | DetID | PixID | Counts | Sigma | Mean | Median | Sigma |
| A | 11 | 47 | 311523 | 755.22 | 1935 | 1905 | 410.0 |
| A | 13 | 254 | 63050 | 149.14 | 1935 | 1905 | 410.0 |
| A | 0 | 13 | 48671 | 114.07 | 1935 | 1905 | 410.0 |
| B | 6 | 159 | 9188058 | 25467.04 | 1943 | 1900 | 360.7 |
| B | 5 | 172 | 249721 | 687.04 | 1943 | 1900 | 360.7 |
| B | 0 | 155 | 216034 | 593.65 | 1943 | 1900 | 360.7 |
| C | 0 | 10 | 358845 | 831.02 | 1841 | 1833 | 429.6 |
| C | 3 | 233 | 170671 | 393.01 | 1841 | 1833 | 429.6 |
| C | 1 | 16 | 99694 | 227.79 | 1841 | 1833 | 429.6 |
| D | 12 | 218 | 6359654 | 16024.77 | 1757 | 1704 | 396.8 |
| D | 13 | 174 | 4487420 | 11305.93 | 1757 | 1704 | 396.8 |
| D | 8 | 195 | 2738118 | 6896.94 | 1757 | 1704 | 396.8 |
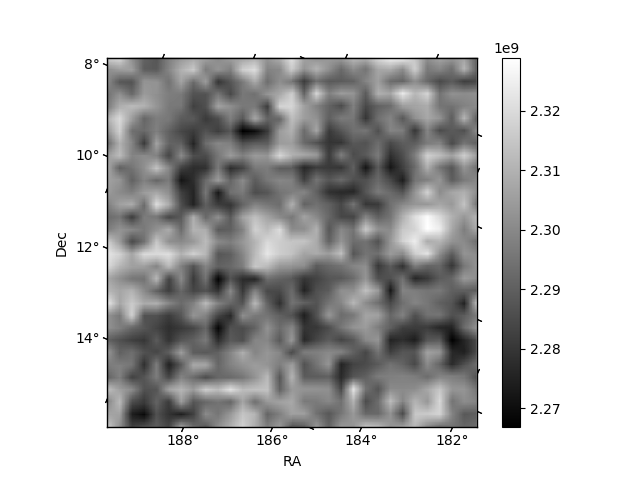
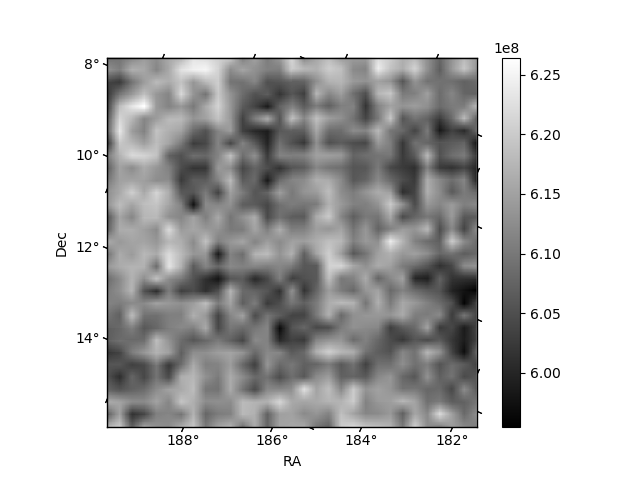
Histogram calculated using DETX and DETY for each event in the final _common_clean file
| Quadrant A |  |
 |
Quadrant B |
|---|---|---|---|
| Quadrant D |  |
 |
Quadrant C |
| Plot type | Count rate plots | Images |
|---|---|---|
| Comparison with Poisson distribution Blue bars denote a histogram of data divided into 1 sec bins. Red curve is a Poisson curve with rate = median count rate of data. |
 |
 |
| Quadrant-wise count rates Data is divided into 100 sec bins |
 |
|
| Module-wise count rates for Quadrant A Data is divided into 100 sec bins |
 |
 |
| Module-wise count rates for Quadrant B Data is divided into 100 sec bins |
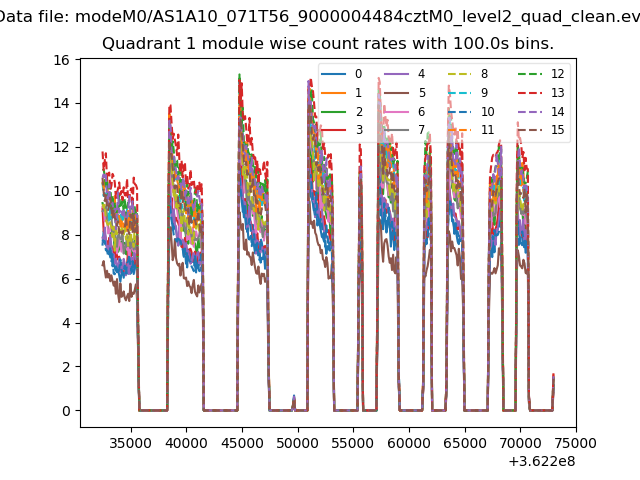 |
 |
| Module-wise count rates for Quadrant C Data is divided into 100 sec bins |
 |
 |
| Module-wise count rates for Quadrant D Data is divided into 100 sec bins |
 |
 |
| Parameter | Plot |
|---|---|
| CZT HV Monitor |  |
| D_VDD |  |
| Temperature 1 | 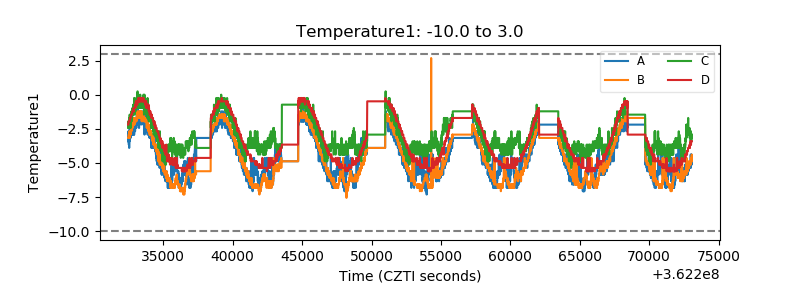 |
| Veto HV Monitor |  |
| Veto LLD |  |
| Alpha Counter |  |
| _CPM_Rate |  |
| CZT Counter |  |
| +2.5 Volts monitor | 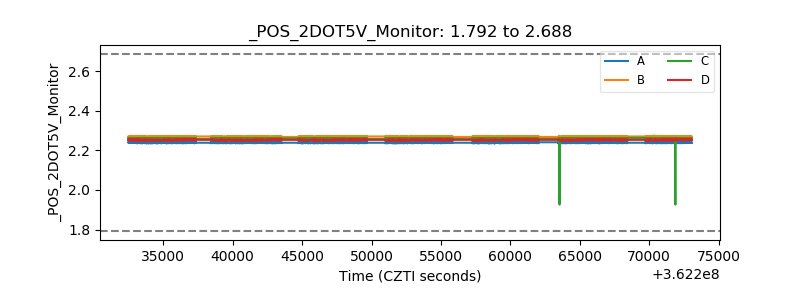 |
| +5 Volts monitor |  |
| _ROLL_ROT |  |
| _Roll_DEC |  |
| _Roll_RA |  |
| Veto Counter |  |