| Param | Original file | Final file |
|---|---|---|
| Filename | modeM0/AS1A10_071T54_9000004482cztM0_level2_bc.evt | modeM0/AS1A10_071T54_9000004482cztM0_level2_quad_clean.evt |
| Size (bytes) | 2,876,074,560 | 718,194,240 |
| Size | 2.7 GB | 684.9 MB |
| Events in quadrant A | 12,334,607 | 4,612,776 |
| Events in quadrant B | 29,546,764 | 4,603,833 |
| Events in quadrant C | 13,324,049 | 4,369,522 |
| Events in quadrant D | 27,932,513 | 4,167,032 |
| Mode M0 | |||
|---|---|---|---|
| Quadrant | BADHDUFLAG | Total packets | Discarded packets |
| A | 0 | 121349 | 0 |
| B | 0 | 180242 | 0 |
| C | 0 | 126615 | 0 |
| D | 0 | 177388 | 0 |
| Mode M9 | |||
|---|---|---|---|
| Quadrant | BADHDUFLAG | Total packets | Discarded packets |
| A | 0 | 86 | 0 |
| B | 0 | 86 | 0 |
| C | 0 | 86 | 0 |
| D | 0 | 86 | 0 |
| Mode SS | |||
|---|---|---|---|
| Quadrant | BADHDUFLAG | Total packets | Discarded packets |
| A | 0 | 1188 | 0 |
| B | 0 | 1188 | 0 |
| C | 0 | 1188 | 0 |
| D | 0 | 1188 | 0 |
| Quadrant | Total seconds | Saturated seconds | Saturation percentage |
|---|---|---|---|
| A | 58290 | 958 | 1.643507% |
| B | 58290 | 1892 | 3.245840% |
| C | 58290 | 1729 | 2.966203% |
| D | 58290 | 4812 | 8.255275% |
Noise dominated data is calculated using 1-second bins in cleaned event files. If a bin has >2000 counts, and if more than 50% of those come from <1% of pixels, then it is considered to be noise-dominated and hence unusable.
| Quadrant | # 1 sec bins | Bins with >0 counts | Bins with >2000 counts | High rate bins dominated by noise | Noise dominated (total time) | Noise dominated (detector-on time) | Marked lightcurve |
|---|---|---|---|---|---|---|---|
| A | 66930 | 58287 | 3 | 3 | 0.00% | 0.01% |  |
| B | 66930 | 58283 | 27 | 27 | 0.04% | 0.05% |  |
| C | 66929 | 58281 | 4 | 4 | 0.01% | 0.01% |  |
| D | 66929 | 58284 | 970 | 970 | 1.45% | 1.66% |  |
Top three noisy pixels from each quadrant. If the there are fewer than three noisy pixels in the level2.evt file, extra rows are filled as -1
| Pixel properties | Quadrant properties | ||||||
|---|---|---|---|---|---|---|---|
| Quadrant | DetID | PixID | Counts | Sigma | Mean | Median | Sigma |
| A | 13 | 254 | 105262 | 150.02 | 3167 | 3111 | 680.9 |
| A | 15 | 174 | 49323 | 67.87 | 3167 | 3111 | 680.9 |
| A | 11 | 47 | 22116 | 27.91 | 3167 | 3111 | 680.9 |
| B | 6 | 159 | 15882191 | 26496.91 | 3183 | 3106 | 599.3 |
| B | 4 | 52 | 476583 | 790.08 | 3183 | 3106 | 599.3 |
| B | 0 | 190 | 278438 | 459.44 | 3183 | 3106 | 599.3 |
| C | 0 | 10 | 1315590 | 1855.22 | 3020 | 3007 | 707.5 |
| C | 3 | 233 | 115292 | 158.71 | 3020 | 3007 | 707.5 |
| C | 2 | 114 | 109042 | 149.87 | 3020 | 3007 | 707.5 |
| D | 12 | 218 | 5443564 | 8036.72 | 3002 | 2906 | 677.0 |
| D | 13 | 174 | 4947929 | 7304.59 | 3002 | 2906 | 677.0 |
| D | 8 | 195 | 4120627 | 6082.53 | 3002 | 2906 | 677.0 |
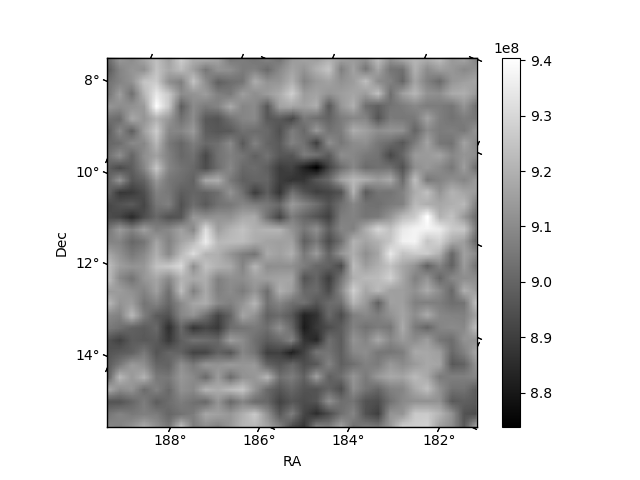
Histogram calculated using DETX and DETY for each event in the final _common_clean file
| Quadrant A | 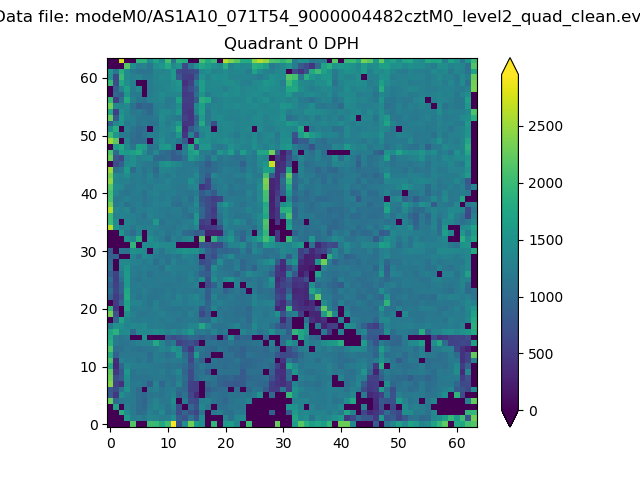 |
 |
Quadrant B |
|---|---|---|---|
| Quadrant D |  |
 |
Quadrant C |
| Plot type | Count rate plots | Images |
|---|---|---|
| Comparison with Poisson distribution Blue bars denote a histogram of data divided into 1 sec bins. Red curve is a Poisson curve with rate = median count rate of data. |
 |
 |
| Quadrant-wise count rates Data is divided into 100 sec bins |
 |
|
| Module-wise count rates for Quadrant A Data is divided into 100 sec bins |
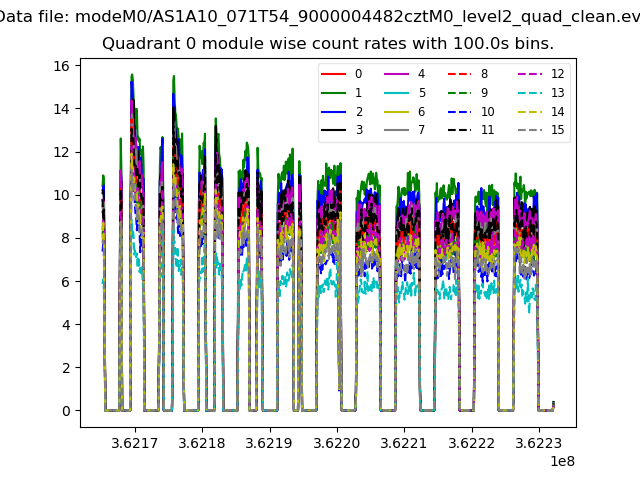 |
 |
| Module-wise count rates for Quadrant B Data is divided into 100 sec bins |
 |
 |
| Module-wise count rates for Quadrant C Data is divided into 100 sec bins |
 |
 |
| Module-wise count rates for Quadrant D Data is divided into 100 sec bins |
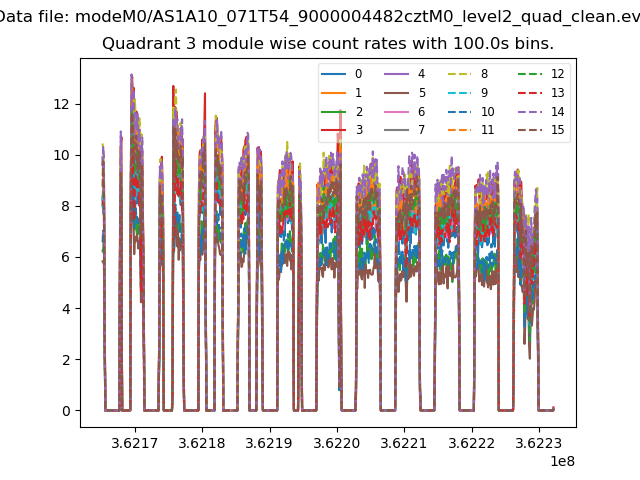 |
 |
| Parameter | Plot |
|---|---|
| CZT HV Monitor | 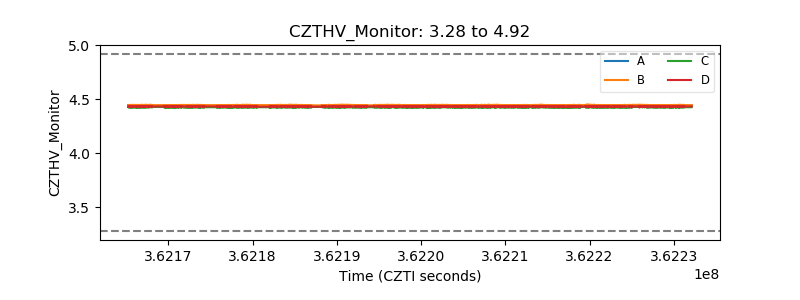 |
| D_VDD |  |
| Temperature 1 |  |
| Veto HV Monitor |  |
| Veto LLD |  |
| Alpha Counter |  |
| _CPM_Rate |  |
| CZT Counter |  |
| +2.5 Volts monitor |  |
| +5 Volts monitor |  |
| _ROLL_ROT |  |
| _Roll_DEC |  |
| _Roll_RA | 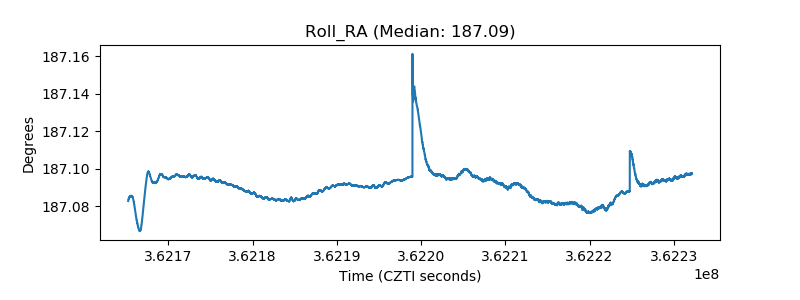 |
| Veto Counter | 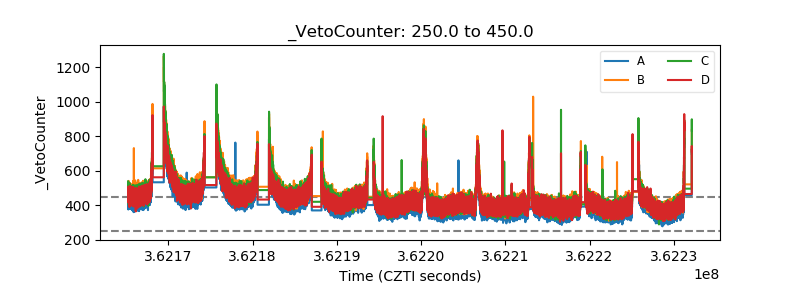 |