| Param | Original file | Final file |
|---|---|---|
| Filename | modeM0/AS1A10_071T52_9000004480cztM0_level2_bc.evt | modeM0/AS1A10_071T52_9000004480cztM0_level2_quad_clean.evt |
| Size (bytes) | 3,500,507,520 | 963,155,520 |
| Size | 3.3 GB | 918.5 MB |
| Events in quadrant A | 16,135,874 | 6,249,413 |
| Events in quadrant B | 38,308,893 | 6,223,336 |
| Events in quadrant C | 19,021,844 | 5,887,196 |
| Events in quadrant D | 27,409,348 | 5,632,251 |
| Mode M0 | |||
|---|---|---|---|
| Quadrant | BADHDUFLAG | Total packets | Discarded packets |
| A | 0 | 157667 | 0 |
| B | 0 | 232383 | 0 |
| C | 0 | 171195 | 0 |
| D | 0 | 201360 | 0 |
| Mode M9 | |||
|---|---|---|---|
| Quadrant | BADHDUFLAG | Total packets | Discarded packets |
| A | 0 | 120 | 0 |
| B | 0 | 120 | 0 |
| C | 0 | 120 | 0 |
| D | 0 | 120 | 0 |
| Mode SS | |||
|---|---|---|---|
| Quadrant | BADHDUFLAG | Total packets | Discarded packets |
| A | 0 | 1540 | 0 |
| B | 0 | 1540 | 0 |
| C | 0 | 1540 | 0 |
| D | 0 | 1540 | 0 |
| Quadrant | Total seconds | Saturated seconds | Saturation percentage |
|---|---|---|---|
| A | 75544 | 1092 | 1.445515% |
| B | 75544 | 2005 | 2.654082% |
| C | 75544 | 2496 | 3.304035% |
| D | 75544 | 3962 | 5.244626% |
Noise dominated data is calculated using 1-second bins in cleaned event files. If a bin has >2000 counts, and if more than 50% of those come from <1% of pixels, then it is considered to be noise-dominated and hence unusable.
| Quadrant | # 1 sec bins | Bins with >0 counts | Bins with >2000 counts | High rate bins dominated by noise | Noise dominated (total time) | Noise dominated (detector-on time) | Marked lightcurve |
|---|---|---|---|---|---|---|---|
| A | 87719 | 75536 | 2 | 2 | 0.00% | 0.00% |  |
| B | 87719 | 75535 | 14 | 14 | 0.02% | 0.02% |  |
| C | 87719 | 75537 | 47 | 47 | 0.05% | 0.06% |  |
| D | 87719 | 75540 | 205 | 205 | 0.23% | 0.27% |  |
Top three noisy pixels from each quadrant. If the there are fewer than three noisy pixels in the level2.evt file, extra rows are filled as -1
| Pixel properties | Quadrant properties | ||||||
|---|---|---|---|---|---|---|---|
| Quadrant | DetID | PixID | Counts | Sigma | Mean | Median | Sigma |
| A | 13 | 254 | 136306 | 148.05 | 4166 | 4096 | 893.0 |
| A | 11 | 47 | 26711 | 25.32 | 4166 | 4096 | 893.0 |
| A | 0 | 226 | 26191 | 24.74 | 4166 | 4096 | 893.0 |
| B | 6 | 159 | 20715542 | 26429.02 | 4182 | 4085 | 783.7 |
| B | 0 | 190 | 390244 | 492.76 | 4182 | 4085 | 783.7 |
| B | 0 | 183 | 317630 | 400.1 | 4182 | 4085 | 783.7 |
| C | 0 | 10 | 3357464 | 3623.66 | 3948 | 3932 | 925.5 |
| C | 3 | 233 | 146968 | 154.56 | 3948 | 3932 | 925.5 |
| C | 2 | 114 | 142148 | 149.35 | 3948 | 3932 | 925.5 |
| D | 8 | 195 | 6750832 | 7470.74 | 3966 | 3835 | 903.1 |
| D | 12 | 218 | 2387297 | 2639.13 | 3966 | 3835 | 903.1 |
| D | 13 | 174 | 1286675 | 1420.45 | 3966 | 3835 | 903.1 |
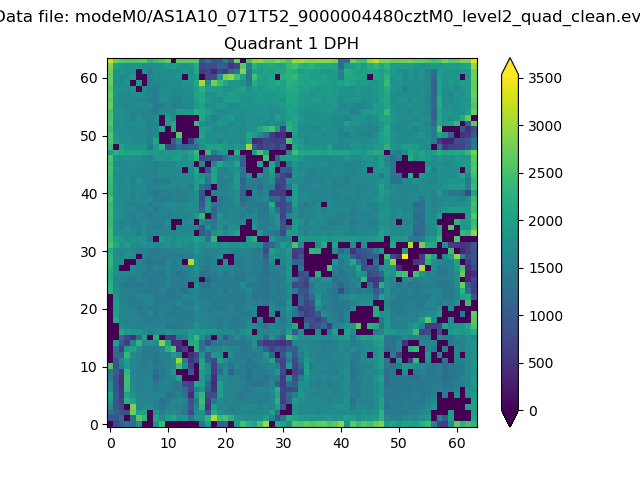
Histogram calculated using DETX and DETY for each event in the final _common_clean file
| Quadrant A |  |
 |
Quadrant B |
|---|---|---|---|
| Quadrant D |  |
 |
Quadrant C |
| Plot type | Count rate plots | Images |
|---|---|---|
| Comparison with Poisson distribution Blue bars denote a histogram of data divided into 1 sec bins. Red curve is a Poisson curve with rate = median count rate of data. |
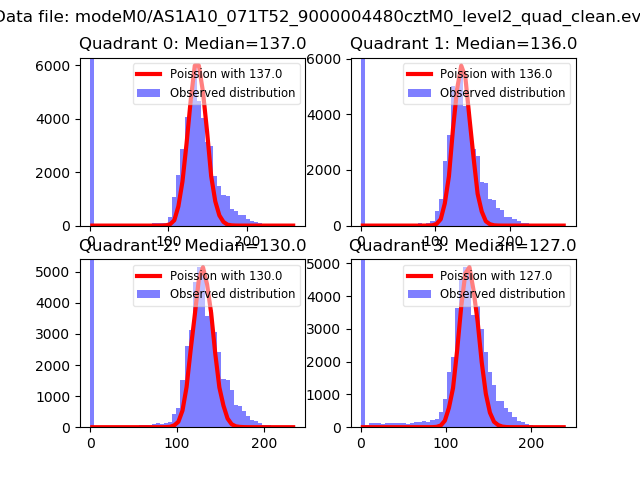 |
 |
| Quadrant-wise count rates Data is divided into 100 sec bins |
 |
|
| Module-wise count rates for Quadrant A Data is divided into 100 sec bins |
 |
 |
| Module-wise count rates for Quadrant B Data is divided into 100 sec bins |
 |
 |
| Module-wise count rates for Quadrant C Data is divided into 100 sec bins |
 |
 |
| Module-wise count rates for Quadrant D Data is divided into 100 sec bins |
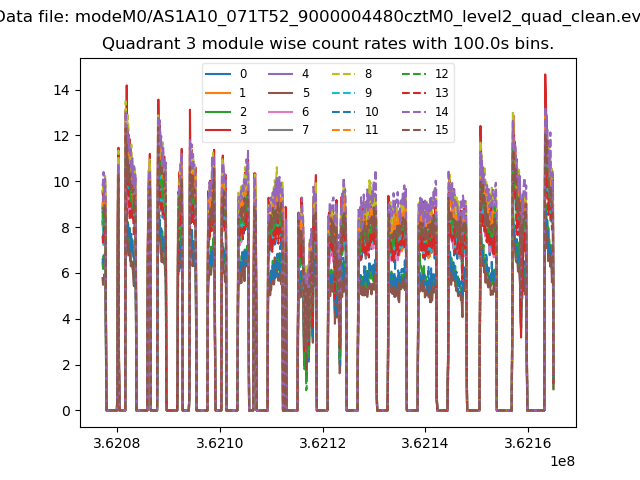 |
 |
| Parameter | Plot |
|---|---|
| CZT HV Monitor | 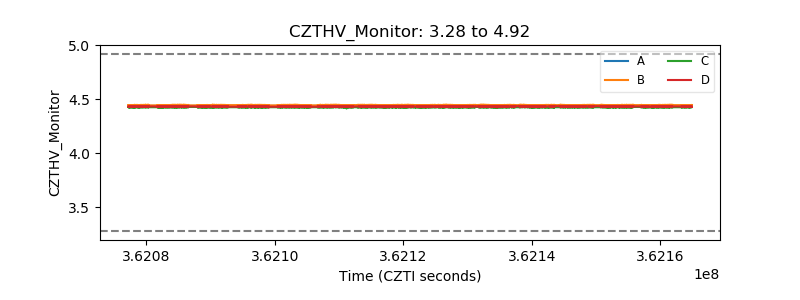 |
| D_VDD |  |
| Temperature 1 |  |
| Veto HV Monitor |  |
| Veto LLD |  |
| Alpha Counter |  |
| _CPM_Rate |  |
| CZT Counter |  |
| +2.5 Volts monitor | 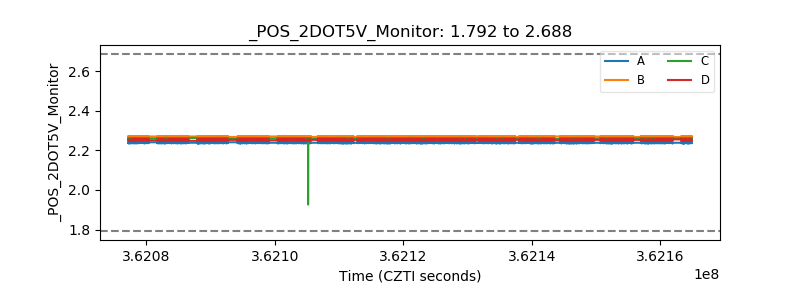 |
| +5 Volts monitor | 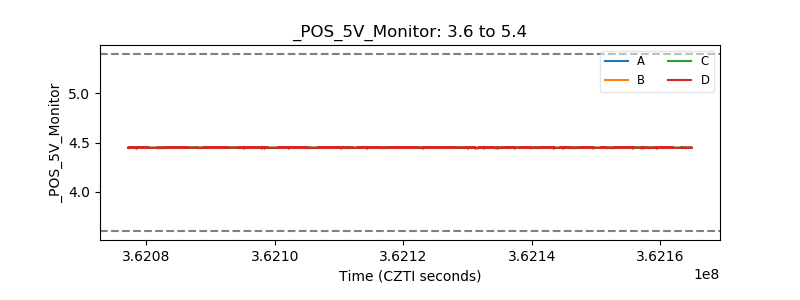 |
| _ROLL_ROT | 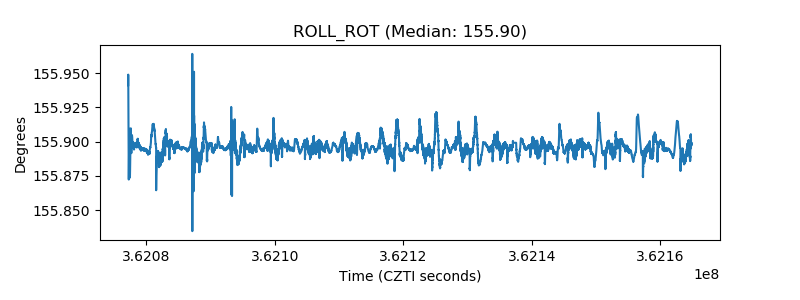 |
| _Roll_DEC |  |
| _Roll_RA |  |
| Veto Counter |  |