| Param | Original file | Final file |
|---|---|---|
| Filename | modeM0/AS1A10_071T48_9000004478cztM0_level2_bc.evt | modeM0/AS1A10_071T48_9000004478cztM0_level2_quad_clean.evt |
| Size (bytes) | 3,638,041,920 | 1,011,216,960 |
| Size | 3.4 GB | 964.4 MB |
| Events in quadrant A | 17,123,283 | 6,525,767 |
| Events in quadrant B | 41,268,999 | 6,420,717 |
| Events in quadrant C | 20,299,693 | 6,173,929 |
| Events in quadrant D | 26,070,531 | 6,046,103 |
| Mode SS | |||
|---|---|---|---|
| Quadrant | BADHDUFLAG | Total packets | Discarded packets |
| A | 0 | 1620 | 0 |
| B | 0 | 1620 | 0 |
| C | 0 | 1620 | 0 |
| D | 0 | 1620 | 0 |
| Mode M9 | |||
|---|---|---|---|
| Quadrant | BADHDUFLAG | Total packets | Discarded packets |
| A | 0 | 135 | 0 |
| B | 0 | 135 | 0 |
| C | 0 | 135 | 0 |
| D | 0 | 135 | 0 |
| Mode M0 | |||
|---|---|---|---|
| Quadrant | BADHDUFLAG | Total packets | Discarded packets |
| A | 0 | 166368 | 0 |
| B | 0 | 249971 | 0 |
| C | 0 | 180773 | 0 |
| D | 0 | 194898 | 0 |
| Quadrant | Total seconds | Saturated seconds | Saturation percentage |
|---|---|---|---|
| A | 79687 | 1085 | 1.361577% |
| B | 79687 | 2891 | 3.627944% |
| C | 79687 | 2529 | 3.173667% |
| D | 79687 | 1547 | 1.941346% |
Noise dominated data is calculated using 1-second bins in cleaned event files. If a bin has >2000 counts, and if more than 50% of those come from <1% of pixels, then it is considered to be noise-dominated and hence unusable.
| Quadrant | # 1 sec bins | Bins with >0 counts | Bins with >2000 counts | High rate bins dominated by noise | Noise dominated (total time) | Noise dominated (detector-on time) | Marked lightcurve |
|---|---|---|---|---|---|---|---|
| A | 92982 | 79681 | 0 | 0 | 0.00% | 0.00% |  |
| B | 92982 | 79678 | 105 | 105 | 0.11% | 0.13% |  |
| C | 92982 | 79677 | 52 | 52 | 0.06% | 0.07% |  |
| D | 92982 | 79682 | 225 | 225 | 0.24% | 0.28% |  |
Top three noisy pixels from each quadrant. If the there are fewer than three noisy pixels in the level2.evt file, extra rows are filled as -1
| Pixel properties | Quadrant properties | ||||||
|---|---|---|---|---|---|---|---|
| Quadrant | DetID | PixID | Counts | Sigma | Mean | Median | Sigma |
| A | 11 | 47 | 141838 | 144.86 | 4400 | 4325 | 949.3 |
| A | 13 | 254 | 139555 | 142.46 | 4400 | 4325 | 949.3 |
| A | 0 | 226 | 27720 | 24.64 | 4400 | 4325 | 949.3 |
| B | 6 | 159 | 21820005 | 26665.07 | 4383 | 4287 | 818.1 |
| B | 5 | 172 | 1044848 | 1271.86 | 4383 | 4287 | 818.1 |
| B | 0 | 190 | 370915 | 448.12 | 4383 | 4287 | 818.1 |
| C | 0 | 10 | 3292256 | 3359.91 | 4175 | 4159 | 978.6 |
| C | 3 | 233 | 352037 | 355.48 | 4175 | 4159 | 978.6 |
| C | 14 | 67 | 216097 | 216.57 | 4175 | 4159 | 978.6 |
| D | 8 | 195 | 2896291 | 2971.77 | 4266 | 4127 | 973.2 |
| D | 1 | 239 | 2109857 | 2163.69 | 4266 | 4127 | 973.2 |
| D | 13 | 174 | 1880816 | 1928.34 | 4266 | 4127 | 973.2 |
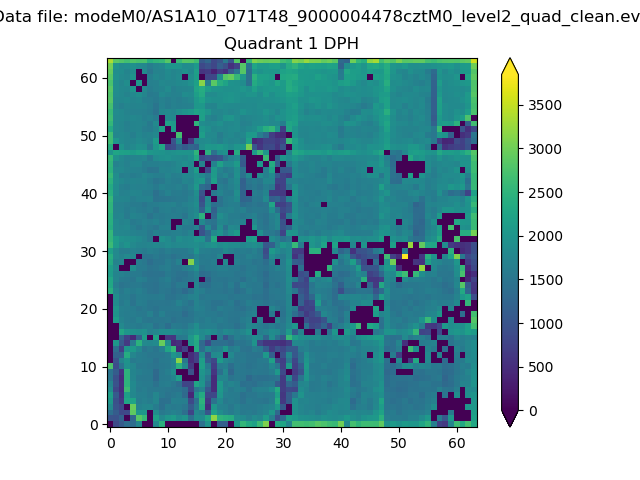
Histogram calculated using DETX and DETY for each event in the final _common_clean file
| Quadrant A |  |
 |
Quadrant B |
|---|---|---|---|
| Quadrant D |  |
 |
Quadrant C |
| Plot type | Count rate plots | Images |
|---|---|---|
| Comparison with Poisson distribution Blue bars denote a histogram of data divided into 1 sec bins. Red curve is a Poisson curve with rate = median count rate of data. |
 |
 |
| Quadrant-wise count rates Data is divided into 100 sec bins |
 |
|
| Module-wise count rates for Quadrant A Data is divided into 100 sec bins |
 |
 |
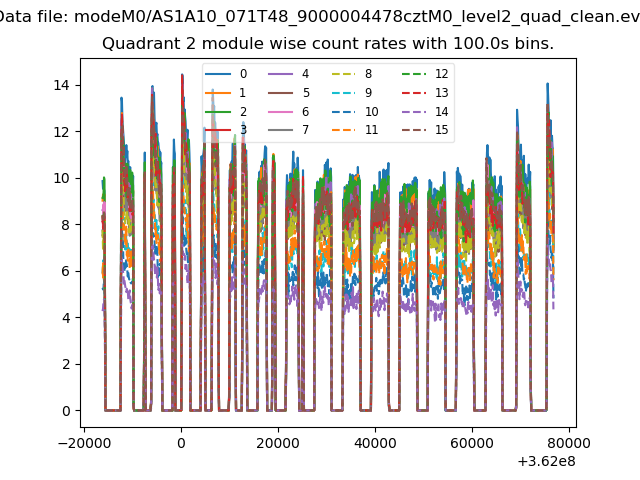
| Module-wise count rates for Quadrant B Data is divided into 100 sec bins |
 |
 |
| Module-wise count rates for Quadrant C Data is divided into 100 sec bins |
 |
 |
| Module-wise count rates for Quadrant D Data is divided into 100 sec bins |
 |
 |
| Parameter | Plot |
|---|---|
| CZT HV Monitor |  |
| D_VDD |  |
| Temperature 1 |  |
| Veto HV Monitor |  |
| Veto LLD |  |
| Alpha Counter | 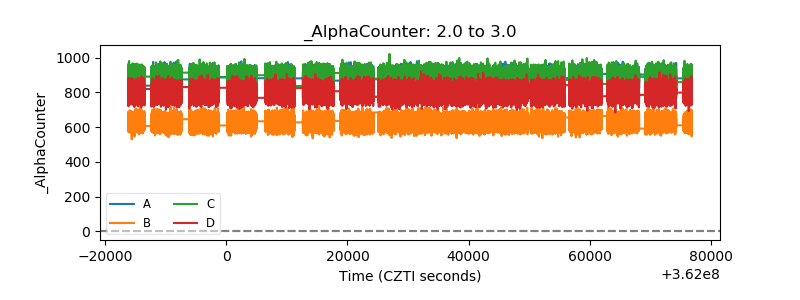 |
| _CPM_Rate |  |
| CZT Counter | 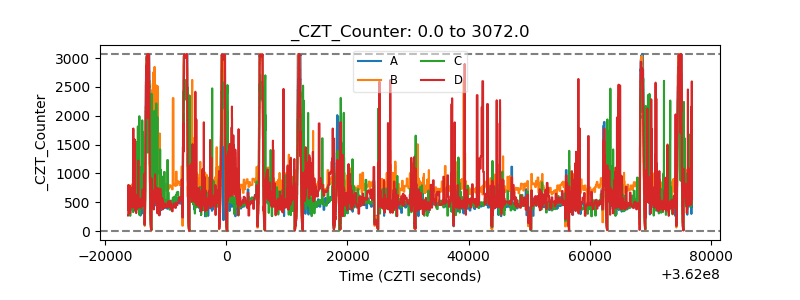 |
| +2.5 Volts monitor |  |
| +5 Volts monitor | 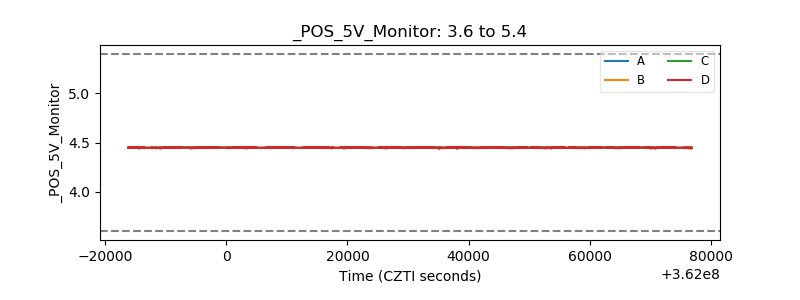 |
| _ROLL_ROT |  |
| _Roll_DEC |  |
| _Roll_RA | 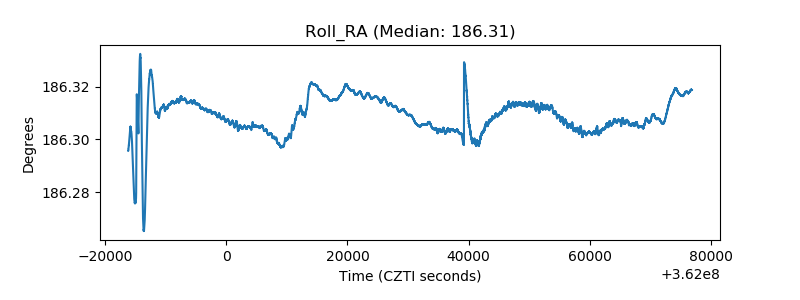 |
| Veto Counter |  |