| Param | Original file | Final file |
|---|---|---|
| Filename | modeM0/AS1A10_058T11_9000004474cztM0_level2_bc.evt | modeM0/AS1A10_058T11_9000004474cztM0_level2_quad_clean.evt |
| Size (bytes) | 3,689,884,800 | 1,055,712,960 |
| Size | 3.4 GB | 1006.8 MB |
| Events in quadrant A | 16,584,322 | 6,834,207 |
| Events in quadrant B | 38,860,351 | 6,792,626 |
| Events in quadrant C | 21,505,789 | 6,591,963 |
| Events in quadrant D | 29,580,295 | 6,492,995 |
| Mode M9 | |||
|---|---|---|---|
| Quadrant | BADHDUFLAG | Total packets | Discarded packets |
| A | 0 | 115 | 0 |
| B | 0 | 116 | 0 |
| C | 0 | 116 | 0 |
| D | 0 | 116 | 0 |
| Mode M0 | |||
|---|---|---|---|
| Quadrant | BADHDUFLAG | Total packets | Discarded packets |
| A | 0 | 161073 | 0 |
| B | 0 | 237873 | 0 |
| C | 0 | 182764 | 0 |
| D | 0 | 209024 | 0 |
| Mode SS | |||
|---|---|---|---|
| Quadrant | BADHDUFLAG | Total packets | Discarded packets |
| A | 0 | 1562 | 0 |
| B | 0 | 1562 | 0 |
| C | 0 | 1562 | 0 |
| D | 0 | 1562 | 0 |
| Quadrant | Total seconds | Saturated seconds | Saturation percentage |
|---|---|---|---|
| A | 76803 | 1082 | 1.408799% |
| B | 76803 | 2412 | 3.140502% |
| C | 76802 | 2695 | 3.509023% |
| D | 76802 | 2281 | 2.969975% |
Noise dominated data is calculated using 1-second bins in cleaned event files. If a bin has >2000 counts, and if more than 50% of those come from <1% of pixels, then it is considered to be noise-dominated and hence unusable.
| Quadrant | # 1 sec bins | Bins with >0 counts | Bins with >2000 counts | High rate bins dominated by noise | Noise dominated (total time) | Noise dominated (detector-on time) | Marked lightcurve |
|---|---|---|---|---|---|---|---|
| A | 104817 | 76797 | 0 | 0 | 0.00% | 0.00% |  |
| B | 104817 | 76797 | 17 | 17 | 0.02% | 0.02% |  |
| C | 104817 | 76794 | 21 | 21 | 0.02% | 0.03% |  |
| D | 104817 | 76799 | 64 | 64 | 0.06% | 0.08% |  |
Top three noisy pixels from each quadrant. If the there are fewer than three noisy pixels in the level2.evt file, extra rows are filled as -1
| Pixel properties | Quadrant properties | ||||||
|---|---|---|---|---|---|---|---|
| Quadrant | DetID | PixID | Counts | Sigma | Mean | Median | Sigma |
| A | 13 | 254 | 122619 | 130.82 | 4270 | 4201 | 905.2 |
| A | 11 | 47 | 102399 | 108.48 | 4270 | 4201 | 905.2 |
| A | 0 | 226 | 26480 | 24.61 | 4270 | 4201 | 905.2 |
| B | 6 | 159 | 20863257 | 26000.07 | 4274 | 4172 | 802.3 |
| B | 4 | 80 | 628136 | 777.75 | 4274 | 4172 | 802.3 |
| B | 0 | 190 | 319234 | 392.71 | 4274 | 4172 | 802.3 |
| C | 3 | 233 | 3258997 | 3371.94 | 4113 | 4102 | 965.3 |
| C | 0 | 10 | 2151108 | 2224.21 | 4113 | 4102 | 965.3 |
| C | 2 | 114 | 142977 | 143.87 | 4113 | 4102 | 965.3 |
| D | 13 | 174 | 7543416 | 7957.63 | 4192 | 4067 | 947.4 |
| D | 8 | 195 | 3549990 | 3742.65 | 4192 | 4067 | 947.4 |
| D | 2 | 250 | 1960979 | 2065.48 | 4192 | 4067 | 947.4 |
Histogram calculated using DETX and DETY for each event in the final _common_clean file
| Quadrant A |  |
 |
Quadrant B |
|---|---|---|---|
| Quadrant D |  |
 |
Quadrant C |
| Plot type | Count rate plots | Images |
|---|---|---|
| Comparison with Poisson distribution Blue bars denote a histogram of data divided into 1 sec bins. Red curve is a Poisson curve with rate = median count rate of data. |
 |
 |
| Quadrant-wise count rates Data is divided into 100 sec bins |
 |
|
| Module-wise count rates for Quadrant A Data is divided into 100 sec bins |
 |
 |
| Module-wise count rates for Quadrant B Data is divided into 100 sec bins |
 |
 |
| Module-wise count rates for Quadrant C Data is divided into 100 sec bins |
 |
 |
| Module-wise count rates for Quadrant D Data is divided into 100 sec bins |
 |
 |
| Parameter | Plot |
|---|---|
| CZT HV Monitor |  |
| D_VDD |  |
| Temperature 1 |  |
| Veto HV Monitor | 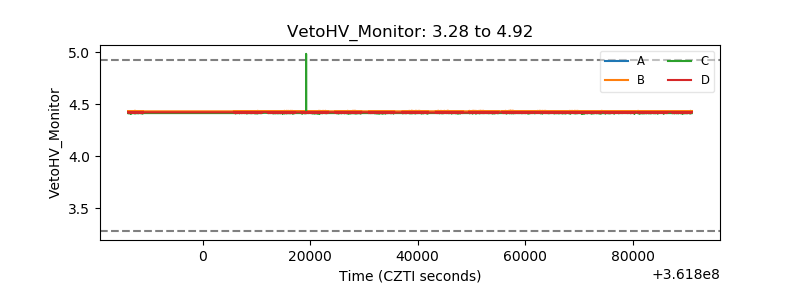 |
| Veto LLD |  |
| Alpha Counter |  |
| _CPM_Rate |  |
| CZT Counter |  |
| +2.5 Volts monitor |  |
| +5 Volts monitor |  |
| _ROLL_ROT | 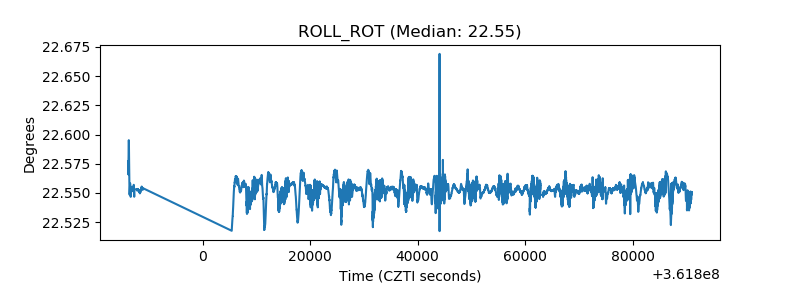 |
| _Roll_DEC |  |
| _Roll_RA |  |
| Veto Counter |  |