| Param | Original file | Final file |
|---|---|---|
| Filename | modeM0/AS1A10_058T10_9000004472cztM0_level2_bc.evt | modeM0/AS1A10_058T10_9000004472cztM0_level2_quad_clean.evt |
| Size (bytes) | 4,318,839,360 | 1,312,122,240 |
| Size | 4.0 GB | 1.2 GB |
| Events in quadrant A | 20,746,565 | 8,516,657 |
| Events in quadrant B | 48,241,064 | 8,472,153 |
| Events in quadrant C | 22,912,051 | 8,199,884 |
| Events in quadrant D | 32,425,430 | 8,029,791 |
| Mode M0 | |||
|---|---|---|---|
| Quadrant | BADHDUFLAG | Total packets | Discarded packets |
| A | 0 | 199613 | 0 |
| B | 0 | 294035 | 0 |
| C | 0 | 213038 | 0 |
| D | 0 | 238292 | 0 |
| Mode M9 | |||
|---|---|---|---|
| Quadrant | BADHDUFLAG | Total packets | Discarded packets |
| A | 0 | 152 | 0 |
| B | 0 | 153 | 0 |
| C | 0 | 153 | 0 |
| D | 0 | 152 | 0 |
| Mode SS | |||
|---|---|---|---|
| Quadrant | BADHDUFLAG | Total packets | Discarded packets |
| A | 0 | 1932 | 0 |
| B | 0 | 1932 | 0 |
| C | 0 | 1938 | 0 |
| D | 0 | 1936 | 0 |
| Quadrant | Total seconds | Saturated seconds | Saturation percentage |
|---|---|---|---|
| A | 95202 | 1031 | 1.082960% |
| B | 95151 | 2341 | 2.460300% |
| C | 95201 | 3588 | 3.768868% |
| D | 95225 | 3387 | 3.556839% |
Noise dominated data is calculated using 1-second bins in cleaned event files. If a bin has >2000 counts, and if more than 50% of those come from <1% of pixels, then it is considered to be noise-dominated and hence unusable.
| Quadrant | # 1 sec bins | Bins with >0 counts | Bins with >2000 counts | High rate bins dominated by noise | Noise dominated (total time) | Noise dominated (detector-on time) | Marked lightcurve |
|---|---|---|---|---|---|---|---|
| A | 124255 | 95335 | 1 | 1 | 0.00% | 0.00% |  |
| B | 124254 | 95316 | 80 | 80 | 0.06% | 0.08% |  |
| C | 124254 | 95332 | 56 | 56 | 0.05% | 0.06% | 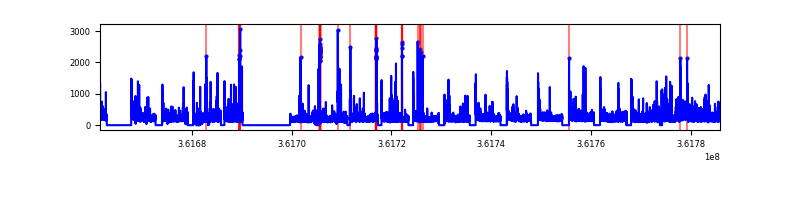 |
| D | 124254 | 95344 | 248 | 248 | 0.20% | 0.26% |  |
Top three noisy pixels from each quadrant. If the there are fewer than three noisy pixels in the level2.evt file, extra rows are filled as -1
| Pixel properties | Quadrant properties | ||||||
|---|---|---|---|---|---|---|---|
| Quadrant | DetID | PixID | Counts | Sigma | Mean | Median | Sigma |
| A | 13 | 254 | 164531 | 141.85 | 5311 | 5227 | 1123.1 |
| A | 11 | 47 | 145886 | 125.25 | 5311 | 5227 | 1123.1 |
| A | 3 | 243 | 65491 | 53.66 | 5311 | 5227 | 1123.1 |
| B | 6 | 159 | 25751190 | 25888.94 | 5334 | 5223 | 994.5 |
| B | 5 | 172 | 564221 | 562.1 | 5334 | 5223 | 994.5 |
| B | 0 | 190 | 535150 | 532.87 | 5334 | 5223 | 994.5 |
| C | 0 | 10 | 1352210 | 1131.45 | 5096 | 5082 | 1190.6 |
| C | 3 | 233 | 1196320 | 1000.51 | 5096 | 5082 | 1190.6 |
| C | 14 | 254 | 317029 | 262.0 | 5096 | 5082 | 1190.6 |
| D | 8 | 195 | 5004789 | 4239.65 | 5200 | 5040 | 1179.3 |
| D | 13 | 174 | 2231888 | 1888.31 | 5200 | 5040 | 1179.3 |
| D | 15 | 47 | 2050693 | 1734.66 | 5200 | 5040 | 1179.3 |
Histogram calculated using DETX and DETY for each event in the final _common_clean file
| Quadrant A |  |
 |
Quadrant B |
|---|---|---|---|
| Quadrant D |  |
 |
Quadrant C |
| Plot type | Count rate plots | Images |
|---|---|---|
| Comparison with Poisson distribution Blue bars denote a histogram of data divided into 1 sec bins. Red curve is a Poisson curve with rate = median count rate of data. |
 |
 |
| Quadrant-wise count rates Data is divided into 100 sec bins |
 |
|
| Module-wise count rates for Quadrant A Data is divided into 100 sec bins |
 |
 |
| Module-wise count rates for Quadrant B Data is divided into 100 sec bins |
 |
 |
| Module-wise count rates for Quadrant C Data is divided into 100 sec bins |
 |
 |
| Module-wise count rates for Quadrant D Data is divided into 100 sec bins |
 |
 |
| Parameter | Plot |
|---|---|
| CZT HV Monitor |  |
| D_VDD |  |
| Temperature 1 |  |
| Veto HV Monitor |  |
| Veto LLD |  |
| Alpha Counter |  |
| _CPM_Rate |  |
| CZT Counter | 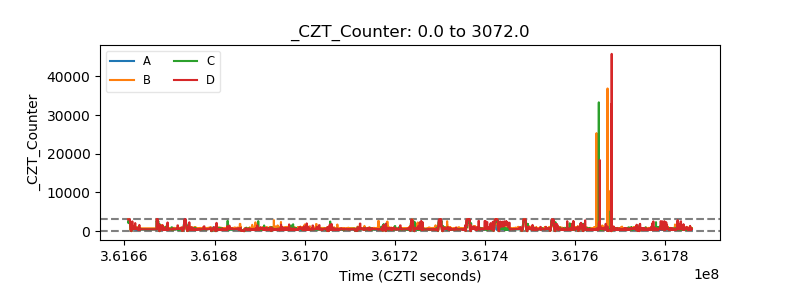 |
| +2.5 Volts monitor |  |
| +5 Volts monitor |  |
| _ROLL_ROT |  |
| _Roll_DEC |  |
| _Roll_RA |  |
| Veto Counter |  |