| Param | Original file | Final file |
|---|---|---|
| Filename | modeM0/AS1C06_007T01_9000004470cztM0_level2_bc.evt | modeM0/AS1C06_007T01_9000004470cztM0_level2_quad_clean.evt |
| Size (bytes) | 5,663,488,320 | 1,352,842,560 |
| Size | 5.3 GB | 1.3 GB |
| Events in quadrant A | 24,458,383 | 8,820,401 |
| Events in quadrant B | 61,993,375 | 8,734,556 |
| Events in quadrant C | 26,320,865 | 8,107,564 |
| Events in quadrant D | 51,438,701 | 7,937,608 |
| Mode M0 | |||
|---|---|---|---|
| Quadrant | BADHDUFLAG | Total packets | Discarded packets |
| A | 0 | 229745 | 0 |
| B | 0 | 352559 | 0 |
| C | 0 | 249624 | 0 |
| D | 0 | 326220 | 0 |
| Mode M9 | |||
|---|---|---|---|
| Quadrant | BADHDUFLAG | Total packets | Discarded packets |
| A | 0 | 165 | 0 |
| B | 0 | 165 | 0 |
| C | 0 | 165 | 0 |
| D | 0 | 165 | 0 |
| Mode SS | |||
|---|---|---|---|
| Quadrant | BADHDUFLAG | Total packets | Discarded packets |
| A | 0 | 2190 | 0 |
| B | 0 | 2190 | 0 |
| C | 0 | 2190 | 0 |
| D | 0 | 2190 | 0 |
| Quadrant | Total seconds | Saturated seconds | Saturation percentage |
|---|---|---|---|
| A | 107563 | 2107 | 1.958852% |
| B | 107563 | 4217 | 3.920493% |
| C | 107563 | 10419 | 9.686416% |
| D | 107563 | 7953 | 7.393806% |
Noise dominated data is calculated using 1-second bins in cleaned event files. If a bin has >2000 counts, and if more than 50% of those come from <1% of pixels, then it is considered to be noise-dominated and hence unusable.
| Quadrant | # 1 sec bins | Bins with >0 counts | Bins with >2000 counts | High rate bins dominated by noise | Noise dominated (total time) | Noise dominated (detector-on time) | Marked lightcurve |
|---|---|---|---|---|---|---|---|
| A | 124073 | 107555 | 69 | 69 | 0.06% | 0.06% |  |
| B | 124073 | 107547 | 108 | 108 | 0.09% | 0.10% |  |
| C | 124073 | 107533 | 28 | 28 | 0.02% | 0.03% |  |
| D | 124073 | 107550 | 593 | 593 | 0.48% | 0.55% |  |
Top three noisy pixels from each quadrant. If the there are fewer than three noisy pixels in the level2.evt file, extra rows are filled as -1
| Pixel properties | Quadrant properties | ||||||
|---|---|---|---|---|---|---|---|
| Quadrant | DetID | PixID | Counts | Sigma | Mean | Median | Sigma |
| A | 0 | 13 | 1940813 | 1551.64 | 5779 | 5679 | 1247.2 |
| A | 13 | 254 | 200632 | 156.32 | 5779 | 5679 | 1247.2 |
| A | 11 | 47 | 111622 | 84.95 | 5779 | 5679 | 1247.2 |
| B | 6 | 159 | 31056728 | 28243.76 | 5800 | 5669 | 1099.4 |
| B | 6 | 36 | 4926655 | 4476.08 | 5800 | 5669 | 1099.4 |
| B | 0 | 190 | 878021 | 793.48 | 5800 | 5669 | 1099.4 |
| C | 3 | 233 | 2962878 | 2362.21 | 5344 | 5343 | 1252.0 |
| C | 14 | 254 | 1130940 | 899.02 | 5344 | 5343 | 1252.0 |
| C | 0 | 10 | 876824 | 696.06 | 5344 | 5343 | 1252.0 |
| D | 8 | 195 | 9056929 | 6555.17 | 5473 | 5324 | 1380.8 |
| D | 12 | 218 | 5651117 | 4088.68 | 5473 | 5324 | 1380.8 |
| D | 12 | 233 | 4314618 | 3120.79 | 5473 | 5324 | 1380.8 |
Histogram calculated using DETX and DETY for each event in the final _common_clean file
| Quadrant A |  |
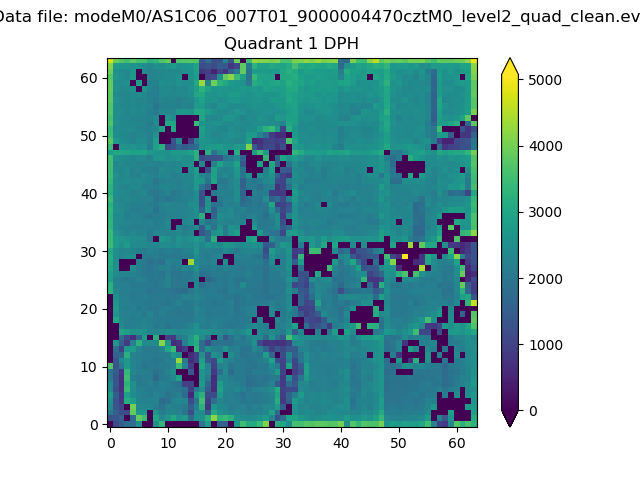 |
Quadrant B |
|---|---|---|---|
| Quadrant D |  |
 |
Quadrant C |
| Plot type | Count rate plots | Images |
|---|---|---|
| Comparison with Poisson distribution Blue bars denote a histogram of data divided into 1 sec bins. Red curve is a Poisson curve with rate = median count rate of data. |
 |
 |
| Quadrant-wise count rates Data is divided into 100 sec bins |
 |
|
| Module-wise count rates for Quadrant A Data is divided into 100 sec bins |
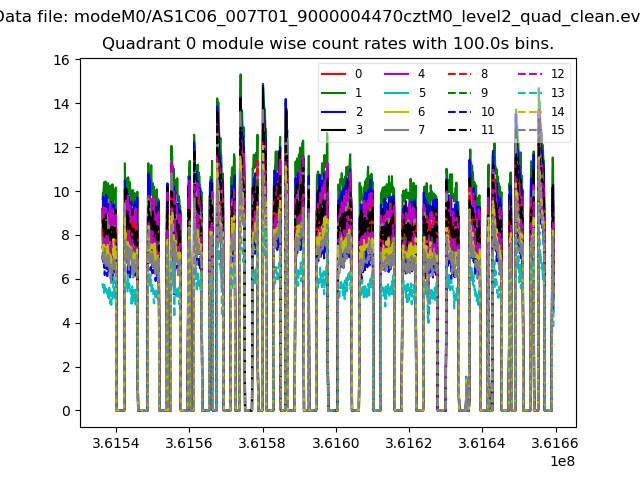 |
 |
| Module-wise count rates for Quadrant B Data is divided into 100 sec bins |
 |
 |
| Module-wise count rates for Quadrant C Data is divided into 100 sec bins |
 |
 |
| Module-wise count rates for Quadrant D Data is divided into 100 sec bins |
 |
 |
| Parameter | Plot |
|---|---|
| CZT HV Monitor |  |
| D_VDD |  |
| Temperature 1 |  |
| Veto HV Monitor |  |
| Veto LLD |  |
| Alpha Counter |  |
| _CPM_Rate |  |
| CZT Counter |  |
| +2.5 Volts monitor |  |
| +5 Volts monitor |  |
| _ROLL_ROT |  |
| _Roll_DEC |  |
| _Roll_RA |  |
| Veto Counter |  |