| Param | Original file | Final file |
|---|---|---|
| Filename | modeM0/AS1C06_006T02_9000004468cztM0_level2_bc.evt | modeM0/AS1C06_006T02_9000004468cztM0_level2_quad_clean.evt |
| Size (bytes) | 243,743,040 | 74,298,240 |
| Size | 232.5 MB | 70.9 MB |
| Events in quadrant A | 1,061,778 | 480,035 |
| Events in quadrant B | 2,641,897 | 479,922 |
| Events in quadrant C | 1,107,540 | 459,073 |
| Events in quadrant D | 2,194,154 | 451,845 |
| Mode SS | |||
|---|---|---|---|
| Quadrant | BADHDUFLAG | Total packets | Discarded packets |
| A | 0 | 108 | 0 |
| B | 0 | 108 | 0 |
| C | 0 | 108 | 0 |
| D | 0 | 108 | 0 |
| Mode M0 | |||
|---|---|---|---|
| Quadrant | BADHDUFLAG | Total packets | Discarded packets |
| A | 0 | 11158 | 0 |
| B | 0 | 16678 | 0 |
| C | 0 | 11573 | 0 |
| D | 0 | 14791 | 0 |
| Quadrant | Total seconds | Saturated seconds | Saturation percentage |
|---|---|---|---|
| A | 5414 | 226 | 4.174363% |
| B | 5414 | 311 | 5.744366% |
| C | 5414 | 387 | 7.148134% |
| D | 5414 | 279 | 5.153306% |
Noise dominated data is calculated using 1-second bins in cleaned event files. If a bin has >2000 counts, and if more than 50% of those come from <1% of pixels, then it is considered to be noise-dominated and hence unusable.
| Quadrant | # 1 sec bins | Bins with >0 counts | Bins with >2000 counts | High rate bins dominated by noise | Noise dominated (total time) | Noise dominated (detector-on time) | Marked lightcurve |
|---|---|---|---|---|---|---|---|
| A | 5414 | 5414 | 0 | 0 | 0.00% | 0.00% |  |
| B | 5414 | 5414 | 0 | 0 | 0.00% | 0.00% |  |
| C | 5414 | 5414 | 1 | 1 | 0.02% | 0.02% |  |
| D | 5413 | 5413 | 10 | 10 | 0.18% | 0.18% | 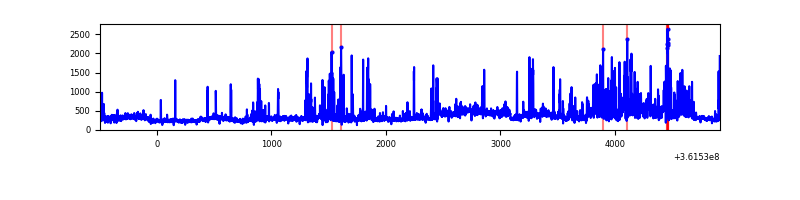 |
Top three noisy pixels from each quadrant. If the there are fewer than three noisy pixels in the level2.evt file, extra rows are filled as -1
| Pixel properties | Quadrant properties | ||||||
|---|---|---|---|---|---|---|---|
| Quadrant | DetID | PixID | Counts | Sigma | Mean | Median | Sigma |
| A | 13 | 254 | 10061 | 156.38 | 274 | 268 | 62.6 |
| A | 0 | 226 | 1723 | 23.23 | 274 | 268 | 62.6 |
| A | 12 | 194 | 1696 | 22.8 | 274 | 268 | 62.6 |
| B | 6 | 159 | 1418231 | 25496.58 | 275 | 267 | 55.6 |
| B | 0 | 190 | 75205 | 1347.47 | 275 | 267 | 55.6 |
| B | 15 | 201 | 18211 | 322.65 | 275 | 267 | 55.6 |
| C | 3 | 233 | 53930 | 846.49 | 261 | 259 | 63.4 |
| C | 14 | 254 | 24631 | 384.39 | 261 | 259 | 63.4 |
| C | 2 | 114 | 10281 | 158.07 | 261 | 259 | 63.4 |
| D | 8 | 195 | 650325 | 10147.24 | 267 | 259 | 64.1 |
| D | 2 | 250 | 200045 | 3118.57 | 267 | 259 | 64.1 |
| D | 13 | 174 | 189388 | 2952.22 | 267 | 259 | 64.1 |
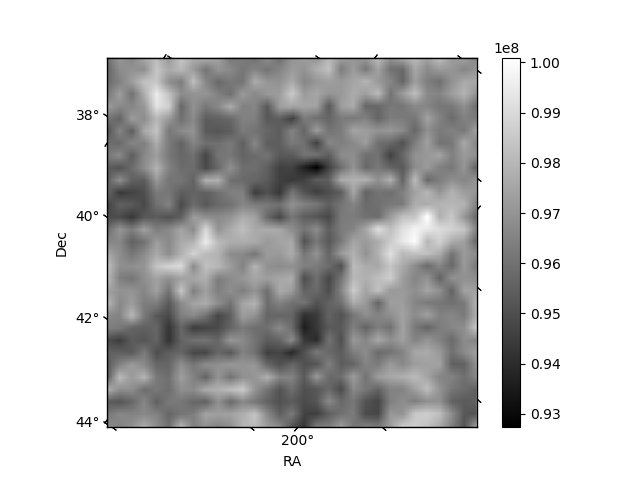
Histogram calculated using DETX and DETY for each event in the final _common_clean file
| Quadrant A | 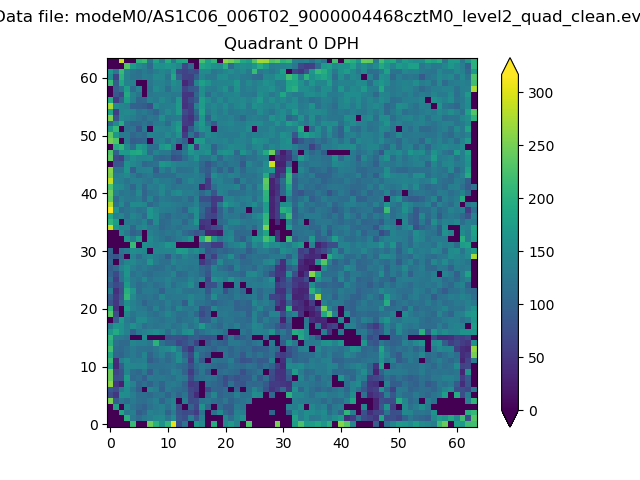 |
 |
Quadrant B |
|---|---|---|---|
| Quadrant D |  |
 |
Quadrant C |
| Plot type | Count rate plots | Images |
|---|---|---|
| Comparison with Poisson distribution Blue bars denote a histogram of data divided into 1 sec bins. Red curve is a Poisson curve with rate = median count rate of data. |
 |
 |
| Quadrant-wise count rates Data is divided into 100 sec bins |
 |
|
| Module-wise count rates for Quadrant A Data is divided into 100 sec bins |
 |
 |
| Module-wise count rates for Quadrant B Data is divided into 100 sec bins |
 |
 |
| Module-wise count rates for Quadrant C Data is divided into 100 sec bins |
 |
 |
| Module-wise count rates for Quadrant D Data is divided into 100 sec bins |
 |
 |
| Parameter | Plot |
|---|---|
| CZT HV Monitor | 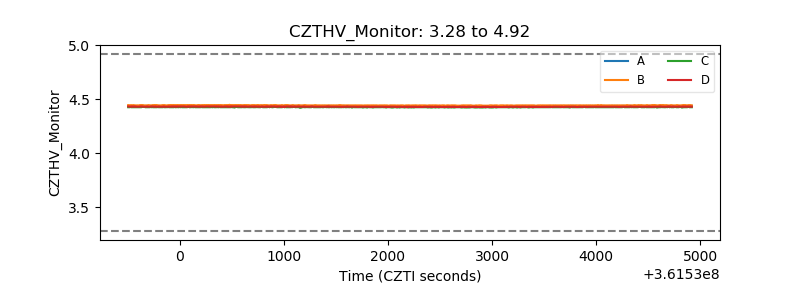 |
| D_VDD |  |
| Temperature 1 |  |
| Veto HV Monitor |  |
| Veto LLD |  |
| Alpha Counter |  |
| _CPM_Rate |  |
| CZT Counter |  |
| +2.5 Volts monitor |  |
| +5 Volts monitor |  |
| _ROLL_ROT |  |
| _Roll_DEC | 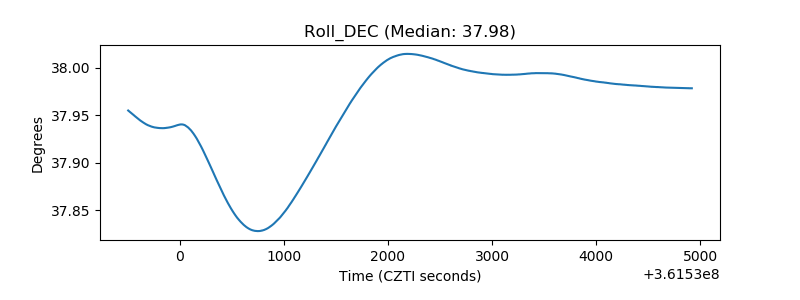 |
| _Roll_RA | 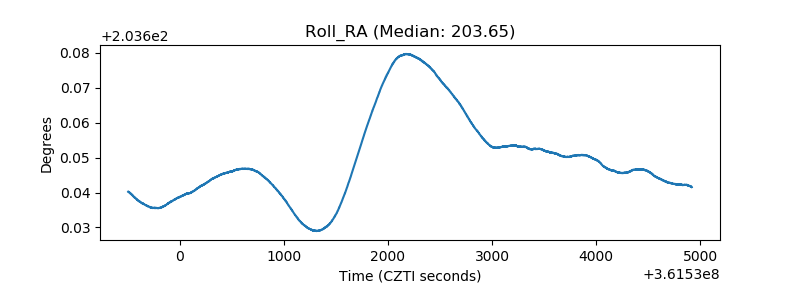 |
| Veto Counter |  |