| Param | Original file | Final file |
|---|---|---|
| Filename | modeM0/AS1C06_004T01_9000004466cztM0_level2_bc.evt | modeM0/AS1C06_004T01_9000004466cztM0_level2_quad_clean.evt |
| Size (bytes) | 3,475,203,840 | 1,024,148,160 |
| Size | 3.2 GB | 976.7 MB |
| Events in quadrant A | 15,391,085 | 6,769,855 |
| Events in quadrant B | 39,734,043 | 6,701,200 |
| Events in quadrant C | 16,366,039 | 6,352,008 |
| Events in quadrant D | 29,019,591 | 6,419,507 |
| Mode M0 | |||
|---|---|---|---|
| Quadrant | BADHDUFLAG | Total packets | Discarded packets |
| A | 0 | 146267 | 0 |
| B | 0 | 226743 | 0 |
| C | 0 | 156912 | 0 |
| D | 0 | 190916 | 0 |
| Mode M9 | |||
|---|---|---|---|
| Quadrant | BADHDUFLAG | Total packets | Discarded packets |
| A | 0 | 112 | 0 |
| B | 0 | 112 | 0 |
| C | 0 | 112 | 0 |
| D | 0 | 112 | 0 |
| Mode SS | |||
|---|---|---|---|
| Quadrant | BADHDUFLAG | Total packets | Discarded packets |
| A | 0 | 1424 | 0 |
| B | 0 | 1424 | 0 |
| C | 0 | 1424 | 0 |
| D | 0 | 1424 | 0 |
| Quadrant | Total seconds | Saturated seconds | Saturation percentage |
|---|---|---|---|
| A | 69665 | 908 | 1.303380% |
| B | 69665 | 2145 | 3.079021% |
| C | 69665 | 5299 | 7.606402% |
| D | 69665 | 2708 | 3.887174% |
Noise dominated data is calculated using 1-second bins in cleaned event files. If a bin has >2000 counts, and if more than 50% of those come from <1% of pixels, then it is considered to be noise-dominated and hence unusable.
| Quadrant | # 1 sec bins | Bins with >0 counts | Bins with >2000 counts | High rate bins dominated by noise | Noise dominated (total time) | Noise dominated (detector-on time) | Marked lightcurve |
|---|---|---|---|---|---|---|---|
| A | 81080 | 69658 | 7 | 7 | 0.01% | 0.01% |  |
| B | 81080 | 69654 | 19 | 19 | 0.02% | 0.03% |  |
| C | 81080 | 69649 | 38 | 38 | 0.05% | 0.05% |  |
| D | 81080 | 69657 | 214 | 214 | 0.26% | 0.31% |  |
Top three noisy pixels from each quadrant. If the there are fewer than three noisy pixels in the level2.evt file, extra rows are filled as -1
| Pixel properties | Quadrant properties | ||||||
|---|---|---|---|---|---|---|---|
| Quadrant | DetID | PixID | Counts | Sigma | Mean | Median | Sigma |
| A | 0 | 13 | 534556 | 648.13 | 3811 | 3758 | 819.0 |
| A | 13 | 254 | 124317 | 147.21 | 3811 | 3758 | 819.0 |
| A | 11 | 47 | 106351 | 125.27 | 3811 | 3758 | 819.0 |
| B | 6 | 159 | 19742388 | 27516.5 | 3807 | 3727 | 717.3 |
| B | 6 | 36 | 3036952 | 4228.44 | 3807 | 3727 | 717.3 |
| B | 0 | 190 | 1066016 | 1480.87 | 3807 | 3727 | 717.3 |
| C | 3 | 233 | 961626 | 1140.03 | 3547 | 3544 | 840.4 |
| C | 0 | 10 | 743272 | 880.21 | 3547 | 3544 | 840.4 |
| C | 14 | 254 | 507933 | 600.18 | 3547 | 3544 | 840.4 |
| D | 8 | 195 | 7294400 | 8638.26 | 3669 | 3578 | 844.0 |
| D | 1 | 52 | 2097482 | 2480.88 | 3669 | 3578 | 844.0 |
| D | 12 | 218 | 1698407 | 2008.05 | 3669 | 3578 | 844.0 |
Histogram calculated using DETX and DETY for each event in the final _common_clean file
| Quadrant A |  |
 |
Quadrant B |
|---|---|---|---|
| Quadrant D |  |
 |
Quadrant C |
| Plot type | Count rate plots | Images |
|---|---|---|
| Comparison with Poisson distribution Blue bars denote a histogram of data divided into 1 sec bins. Red curve is a Poisson curve with rate = median count rate of data. |
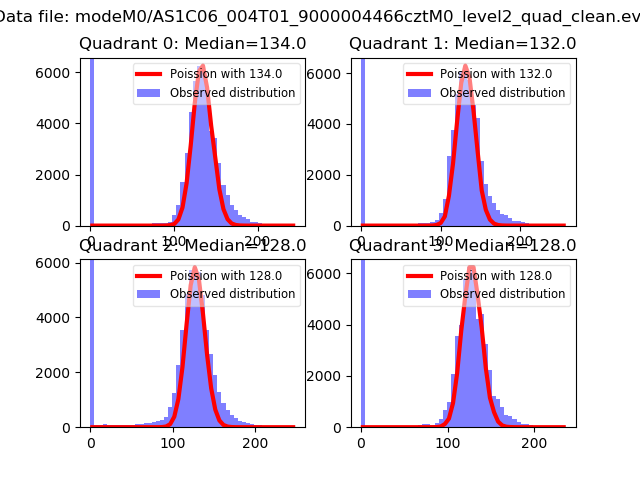 |
 |
| Quadrant-wise count rates Data is divided into 100 sec bins |
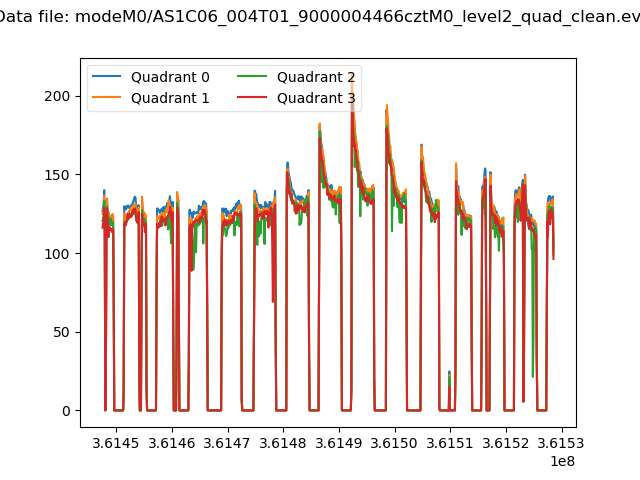 |
|
| Module-wise count rates for Quadrant A Data is divided into 100 sec bins |
 |
 |
| Module-wise count rates for Quadrant B Data is divided into 100 sec bins |
 |
 |
| Module-wise count rates for Quadrant C Data is divided into 100 sec bins |
 |
 |
| Module-wise count rates for Quadrant D Data is divided into 100 sec bins |
 |
 |
| Parameter | Plot |
|---|---|
| CZT HV Monitor |  |
| D_VDD |  |
| Temperature 1 |  |
| Veto HV Monitor |  |
| Veto LLD | 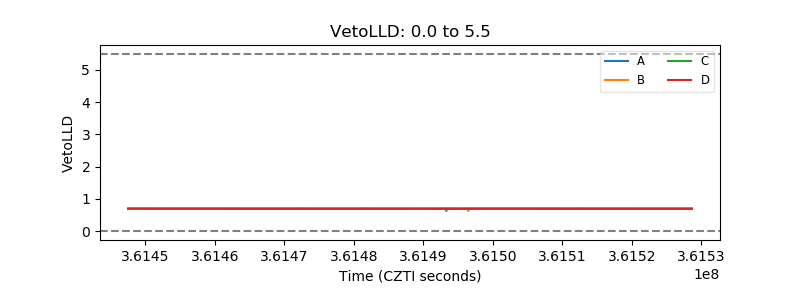 |
| Alpha Counter |  |
| _CPM_Rate | 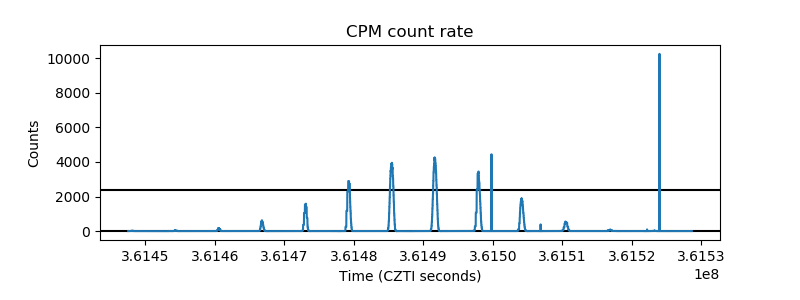 |
| CZT Counter |  |
| +2.5 Volts monitor | 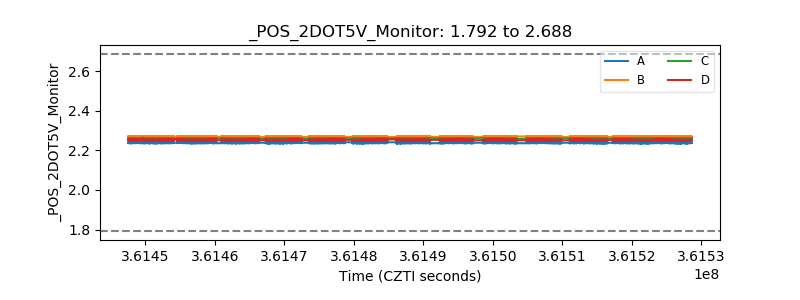 |
| +5 Volts monitor | 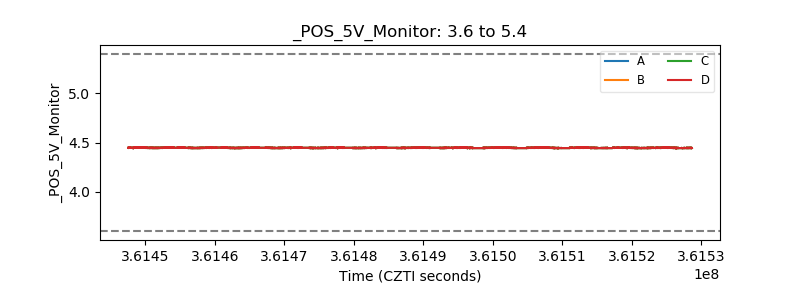 |
| _ROLL_ROT |  |
| _Roll_DEC |  |
| _Roll_RA |  |
| Veto Counter |  |