| Param | Original file | Final file |
|---|---|---|
| Filename | modeM0/AS1A10_071T28_9000004464cztM0_level2_bc.evt | modeM0/AS1A10_071T28_9000004464cztM0_level2_quad_clean.evt |
| Size (bytes) | 3,450,720,960 | 868,752,000 |
| Size | 3.2 GB | 828.5 MB |
| Events in quadrant A | 15,291,884 | 5,588,544 |
| Events in quadrant B | 40,359,110 | 5,519,023 |
| Events in quadrant C | 16,419,721 | 5,261,106 |
| Events in quadrant D | 27,682,476 | 5,147,714 |
| Mode M9 | |||
|---|---|---|---|
| Quadrant | BADHDUFLAG | Total packets | Discarded packets |
| A | 0 | 112 | 0 |
| B | 0 | 112 | 0 |
| C | 0 | 112 | 0 |
| D | 0 | 112 | 0 |
| Mode M0 | |||
|---|---|---|---|
| Quadrant | BADHDUFLAG | Total packets | Discarded packets |
| A | 0 | 146292 | 0 |
| B | 0 | 229928 | 0 |
| C | 0 | 152775 | 0 |
| D | 0 | 187063 | 0 |
| Mode SS | |||
|---|---|---|---|
| Quadrant | BADHDUFLAG | Total packets | Discarded packets |
| A | 0 | 1430 | 0 |
| B | 0 | 1430 | 0 |
| C | 0 | 1430 | 0 |
| D | 0 | 1430 | 0 |
| Quadrant | Total seconds | Saturated seconds | Saturation percentage |
|---|---|---|---|
| A | 69932 | 972 | 1.389922% |
| B | 69932 | 2935 | 4.196934% |
| C | 69932 | 2116 | 3.025796% |
| D | 69931 | 2144 | 3.065879% |
Noise dominated data is calculated using 1-second bins in cleaned event files. If a bin has >2000 counts, and if more than 50% of those come from <1% of pixels, then it is considered to be noise-dominated and hence unusable.
| Quadrant | # 1 sec bins | Bins with >0 counts | Bins with >2000 counts | High rate bins dominated by noise | Noise dominated (total time) | Noise dominated (detector-on time) | Marked lightcurve |
|---|---|---|---|---|---|---|---|
| A | 81397 | 69926 | 2 | 2 | 0.00% | 0.00% |  |
| B | 81397 | 69921 | 87 | 87 | 0.11% | 0.12% |  |
| C | 81397 | 69924 | 66 | 66 | 0.08% | 0.09% |  |
| D | 81397 | 69926 | 109 | 109 | 0.13% | 0.16% |  |
Top three noisy pixels from each quadrant. If the there are fewer than three noisy pixels in the level2.evt file, extra rows are filled as -1
| Pixel properties | Quadrant properties | ||||||
|---|---|---|---|---|---|---|---|
| Quadrant | DetID | PixID | Counts | Sigma | Mean | Median | Sigma |
| A | 0 | 31 | 254086 | 302.31 | 3876 | 3815 | 827.9 |
| A | 13 | 254 | 116608 | 136.25 | 3876 | 3815 | 827.9 |
| A | 11 | 47 | 37275 | 40.42 | 3876 | 3815 | 827.9 |
| B | 6 | 159 | 18921858 | 25915.53 | 3884 | 3799 | 730.0 |
| B | 6 | 36 | 4776822 | 6538.48 | 3884 | 3799 | 730.0 |
| B | 0 | 190 | 476072 | 646.96 | 3884 | 3799 | 730.0 |
| C | 0 | 10 | 1430742 | 1660.54 | 3664 | 3655 | 859.4 |
| C | 3 | 233 | 391208 | 450.95 | 3664 | 3655 | 859.4 |
| C | 1 | 16 | 262030 | 300.64 | 3664 | 3655 | 859.4 |
| D | 8 | 195 | 6510489 | 7720.24 | 3687 | 3598 | 842.8 |
| D | 12 | 218 | 2068710 | 2450.19 | 3687 | 3598 | 842.8 |
| D | 1 | 52 | 1828676 | 2165.4 | 3687 | 3598 | 842.8 |
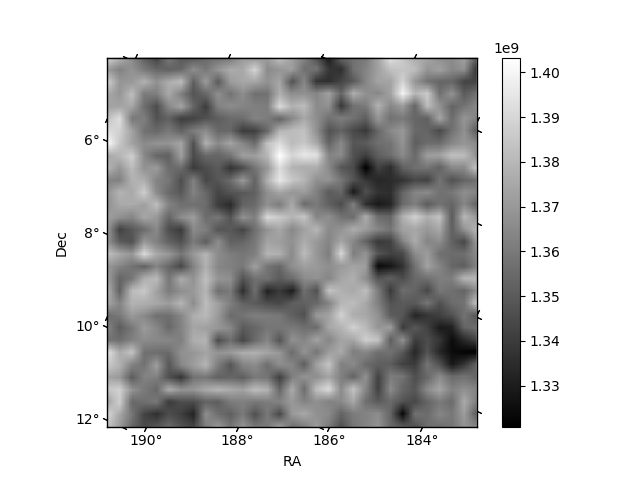
Histogram calculated using DETX and DETY for each event in the final _common_clean file
| Quadrant A |  |
 |
Quadrant B |
|---|---|---|---|
| Quadrant D |  |
 |
Quadrant C |
| Plot type | Count rate plots | Images |
|---|---|---|
| Comparison with Poisson distribution Blue bars denote a histogram of data divided into 1 sec bins. Red curve is a Poisson curve with rate = median count rate of data. |
 |
 |
| Quadrant-wise count rates Data is divided into 100 sec bins |
 |
|
| Module-wise count rates for Quadrant A Data is divided into 100 sec bins |
 |
 |
| Module-wise count rates for Quadrant B Data is divided into 100 sec bins |
 |
 |
| Module-wise count rates for Quadrant C Data is divided into 100 sec bins |
 |
 |
| Module-wise count rates for Quadrant D Data is divided into 100 sec bins |
 |
 |
| Parameter | Plot |
|---|---|
| CZT HV Monitor |  |
| D_VDD |  |
| Temperature 1 |  |
| Veto HV Monitor |  |
| Veto LLD |  |
| Alpha Counter |  |
| _CPM_Rate |  |
| CZT Counter |  |
| +2.5 Volts monitor |  |
| +5 Volts monitor |  |
| _ROLL_ROT | 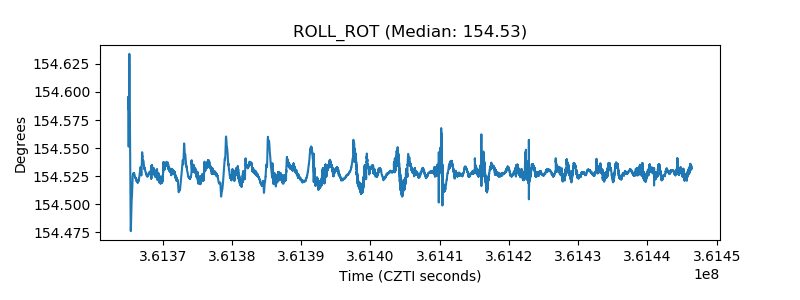 |
| _Roll_DEC |  |
| _Roll_RA |  |
| Veto Counter |  |